The post Ethereum Hovers at $2,150 — Can ETH Price Rally to $2,400 or Stall Below $2,200? appeared first on Coinpedia Fintech News Ethereum price has reclaimed The post Ethereum Hovers at $2,150 — Can ETH Price Rally to $2,400 or Stall Below $2,200? appeared first on Coinpedia Fintech News Ethereum price has reclaimed

Ethereum Hovers at $2,150 — Can ETH Price Rally to $2,400 or Stall Below $2,200?

2026/03/05 19:32
3 min read
For feedback or concerns regarding this content, please contact us at crypto.news@mexc.com
Ethereum Queue Hits 3.4M ETH, 60-Day Wait

The post Ethereum Hovers at $2,150 — Can ETH Price Rally to $2,400 or Stall Below $2,200? appeared first on Coinpedia Fintech News

Ethereum price has reclaimed the $2,150 level after a strong bounce from the recent lows, signaling a shift in short-term market momentum. The second-largest cryptocurrency is now approaching a crucial resistance near $2,200, a level that has repeatedly capped upside attempts over the past sessions.

With buying pressure gradually increasing and the broader crypto market showing renewed strength led by Bitcoin, traders are now watching whether ETH can secure a decisive breakout above $2,200, which could open the path toward $2,350–$2,400.  However, the crypto is struggling to reach $2200, which raises the possibility of the current rise being a short-term bounce.

Liquidation Data Shows Strong Barrier Near $2,200

Ethereum is approaching a critical resistance near $2,200, and the liquidation map suggests that this level may be difficult to break immediately.

Data from the ETH Exchange Liquidation Map shows a dense cluster of leveraged positions between $2,150 and $2,220. These positions represent traders using high leverage on major exchanges like Binance, OKX, and Bybit.

eth price

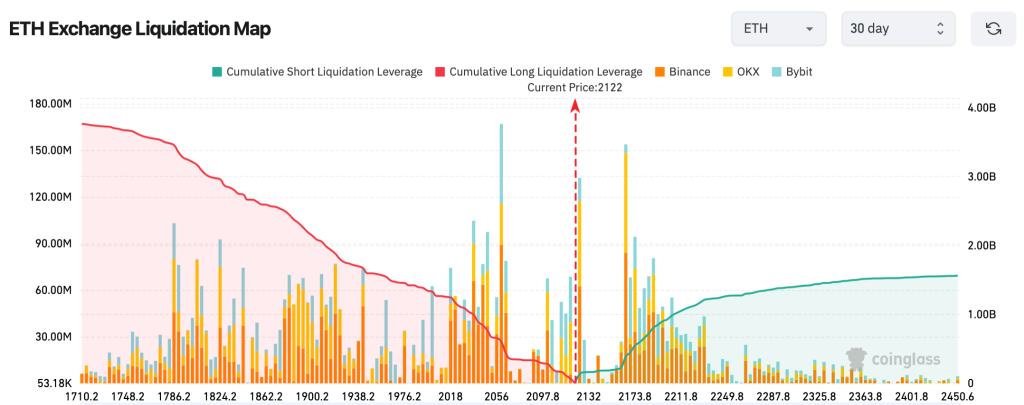
If Ethereum moves toward $2,200, a large number of long positions could face liquidation, which typically increases volatility and selling pressure. This concentration of leverage creates a liquidity wall, making it harder for ETH to sustain a breakout on the first attempt.

At the same time, the chart also reveals a large short liquidation pool above $2,200, extending toward $2,300. If Ethereum manages to break and hold above $2,200, these short positions could be forced to close, potentially triggering a short squeeze that may push ETH toward $2,350–$2,400.

Ethereum Open Interest Shows Leverage Reset in the Market

Derivatives data suggests that Ethereum recently experienced a significant leverage reset. Exchange open interest dropped sharply from nearly $42 billion in early January to around $27–$28 billion, indicating that a large number of leveraged positions were flushed out during the recent market correction.

eth price

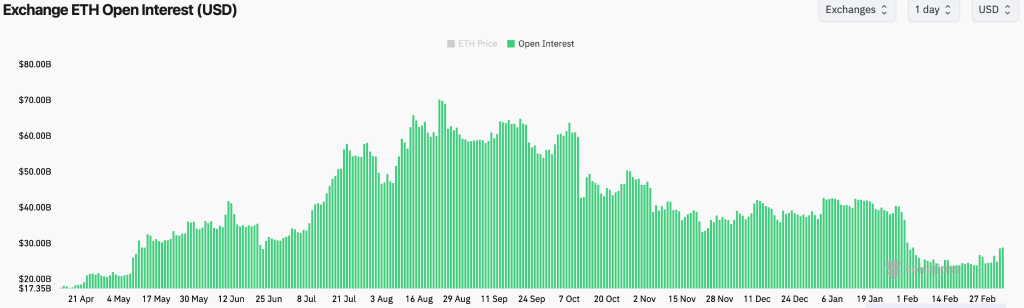
This decline in open interest reflects reduced speculative activity, as traders closed positions amid the broader market pullback. However, the recent stabilization and slight uptick in open interest suggest that market participants are gradually rebuilding positions as Ethereum attempts to reclaim higher resistance levels.

A sustained increase in open interest alongside rising prices would signal renewed market confidence, which could support Ethereum’s attempt to break above the $2,200 resistance zone.

Ethereum Price Faces Strong Resistance Near $2,214

The price is currently trading within a key range between $1,914 and $2,214 that emerged as a crucial resistance. A breakout above this level could open the door for a move toward the next resistance near $2,360–$2,400.

eth price

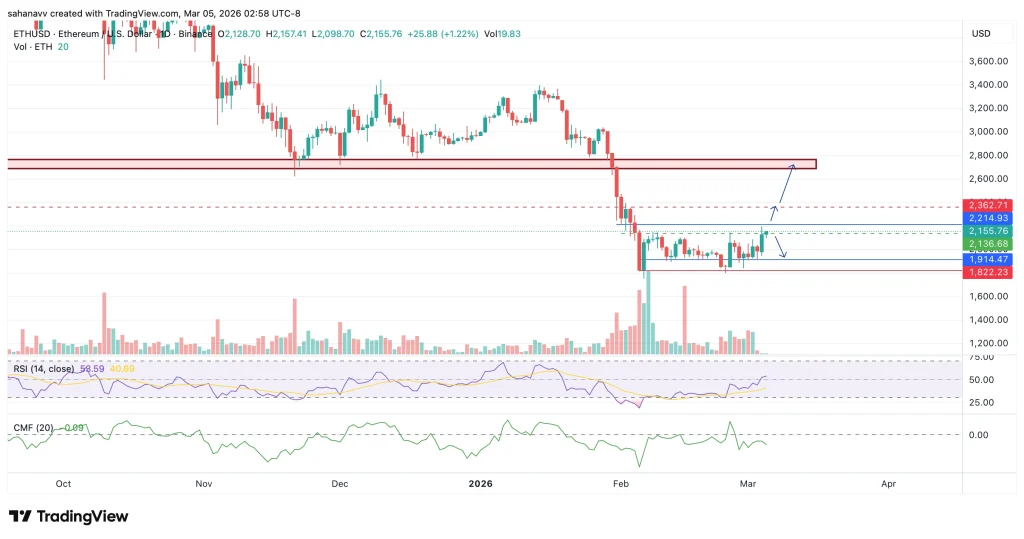
Momentum indicators also show early signs of recovery. The Relative Strength Index (RSI) has climbed above the neutral 50 level, indicating improving bullish momentum. Meanwhile, the Chaikin Money Flow (CMF) is stabilizing, suggesting that capital inflows are gradually returning to the market.

However, if Ethereum price fails to clear the $2,214 resistance, the price may continue consolidating between $1,914 and $2,200 in the near term.

Market Opportunity
Ethereum Logo
Ethereum Price(ETH)
$2,087.37
$2,087.37$2,087.37
-2.91%
USD
Ethereum (ETH) Live Price Chart
Disclaimer: The articles reposted on this site are sourced from public platforms and are provided for informational purposes only. They do not necessarily reflect the views of MEXC. All rights remain with the original authors. If you believe any content infringes on third-party rights, please contact crypto.news@mexc.com for removal. MEXC makes no guarantees regarding the accuracy, completeness, or timeliness of the content and is not responsible for any actions taken based on the information provided. The content does not constitute financial, legal, or other professional advice, nor should it be considered a recommendation or endorsement by MEXC.

You May Also Like

X money beta expands with 6% yield and cashback in beta

X money beta expands with 6% yield and cashback in beta

The post X money beta expands with 6% yield and cashback in beta appeared on BitcoinEthereumNews.com. This week, Elon Musk moved another step toward his vision
Share
BitcoinEthereumNews2026/03/05 20:55
Crucial US Stock Market Update: What Wednesday’s Mixed Close Reveals

Crucial US Stock Market Update: What Wednesday’s Mixed Close Reveals

BitcoinWorld Crucial US Stock Market Update: What Wednesday’s Mixed Close Reveals The financial world often keeps us on our toes, and Wednesday was no exception. Investors watched closely as the US stock market concluded the day with a mixed performance across its major indexes. This snapshot offers a crucial glimpse into current investor sentiment and economic undercurrents, prompting many to ask: what exactly happened? Understanding the Latest US Stock Market Movements On Wednesday, the closing bell brought a varied picture for the US stock market. While some indexes celebrated gains, others registered slight declines, creating a truly mixed bag for investors. The Dow Jones Industrial Average showed resilience, climbing by a notable 0.57%. This positive movement suggests strength in some of the larger, more established companies. Conversely, the S&P 500, a broader benchmark often seen as a barometer for the overall market, experienced a modest dip of 0.1%. The technology-heavy Nasdaq Composite also saw a slight retreat, sliding by 0.33%. This particular index often reflects investor sentiment towards growth stocks and the tech sector. These divergent outcomes highlight the complex dynamics currently at play within the American economy. It’s not simply a matter of “up” or “down” for the entire US stock market; rather, it’s a nuanced landscape where different sectors and company types are responding to unique pressures and opportunities. Why Did the US Stock Market See Mixed Results? When the US stock market delivers a mixed performance, it often points to a tug-of-war between various economic factors. Several elements could have contributed to Wednesday’s varied closings. For instance, positive corporate earnings reports from certain industries might have bolstered the Dow. At the same time, concerns over inflation, interest rate policies by the Federal Reserve, or even global economic uncertainties could have pressured growth stocks, affecting the S&P 500 and Nasdaq. Key considerations often include: Economic Data: Recent reports on employment, manufacturing, or consumer spending can sway market sentiment. Corporate Announcements: Strong or weak earnings forecasts from influential companies can significantly impact their respective sectors. Interest Rate Expectations: The prospect of higher or lower interest rates directly influences borrowing costs for businesses and consumer spending, affecting future profitability. Geopolitical Events: Global tensions or trade policies can introduce uncertainty, causing investors to become more cautious. Understanding these underlying drivers is crucial for anyone trying to make sense of daily market fluctuations in the US stock market. Navigating Volatility in the US Stock Market A mixed close, while not a dramatic downturn, serves as a reminder that market volatility is a constant companion for investors. For those involved in the US stock market, particularly individuals managing their portfolios, these days underscore the importance of a well-thought-out strategy. It’s important not to react impulsively to daily movements. Instead, consider these actionable insights: Diversification: Spreading investments across different sectors and asset classes can help mitigate risk when one area underperforms. Long-Term Perspective: Focusing on long-term financial goals rather than short-term gains can help weather daily market swings. Stay Informed: Keeping abreast of economic news and company fundamentals provides context for market behavior. Consult Experts: Financial advisors can offer personalized guidance based on individual risk tolerance and objectives. Even small movements in major indexes can signal shifts that require attention, guiding future investment decisions within the dynamic US stock market. What’s Next for the US Stock Market? Looking ahead, investors will be keenly watching for further economic indicators and corporate announcements to gauge the direction of the US stock market. Upcoming inflation data, statements from the Federal Reserve, and quarterly earnings reports will likely provide more clarity. The interplay of these factors will continue to shape investor confidence and, consequently, the performance of the Dow, S&P 500, and Nasdaq. Remaining informed and adaptive will be key to understanding the market’s trajectory. Conclusion: Wednesday’s mixed close in the US stock market highlights the intricate balance of forces influencing financial markets. While the Dow showed strength, the S&P 500 and Nasdaq experienced slight declines, reflecting a nuanced economic landscape. This reminds us that understanding the ‘why’ behind these movements is as important as the movements themselves. As always, a thoughtful, informed approach remains the best strategy for navigating the complexities of the market. Frequently Asked Questions (FAQs) Q1: What does a “mixed close” mean for the US stock market? A1: A mixed close indicates that while some major stock indexes advanced, others declined. It suggests that different sectors or types of companies within the US stock market are experiencing varying influences, rather than a uniform market movement. Q2: Which major indexes were affected on Wednesday? A2: On Wednesday, the Dow Jones Industrial Average gained 0.57%, while the S&P 500 edged down 0.1%, and the Nasdaq Composite slid 0.33%, illustrating the mixed performance across the US stock market. Q3: What factors contribute to a mixed stock market performance? A3: Mixed performances in the US stock market can be influenced by various factors, including specific corporate earnings, economic data releases, shifts in interest rate expectations, and broader geopolitical events that affect different market segments uniquely. Q4: How should investors react to mixed market signals? A4: Investors are generally advised to maintain a long-term perspective, diversify their portfolios, stay informed about economic news, and avoid impulsive decisions. Consulting a financial advisor can also provide personalized guidance for navigating the US stock market. Q5: What indicators should investors watch for future US stock market trends? A5: Key indicators to watch include upcoming inflation reports, statements from the Federal Reserve regarding monetary policy, and quarterly corporate earnings reports. These will offer insights into the future direction of the US stock market. Did you find this analysis of the US stock market helpful? Share this article with your network on social media to help others understand the nuances of current financial trends! To learn more about the latest stock market trends, explore our article on key developments shaping the US stock market‘s future performance. This post Crucial US Stock Market Update: What Wednesday’s Mixed Close Reveals first appeared on BitcoinWorld.
Share
Coinstats2025/09/18 05:30
Surge Reload or Downside Drift Ahead?

Surge Reload or Downside Drift Ahead?

The post Surge Reload or Downside Drift Ahead? appeared on BitcoinEthereumNews.com. Pump.fun is hovering at the $0.0020 mark. PUMP’s trading volume has soared by
Share
BitcoinEthereumNews2026/03/05 21:25