

Web3 Funding Trends Report for Q2 2025: A Year of Silent Execution, with Infrastructure Still the Focus
By Robert Osborne, Outlier Ventures
Compiled by AididiaoJP, Foresight News
summary
- Web3 venture funding surged to $9.6 billion, the second-highest quarter on record, even as the number of disclosed deals fell to just 306 rounds.
- Capital concentration increased. Fewer companies raised more funding, and median round sizes increased across all stages. Series A funding reached $17.6 million, the highest level in more than two years.
- Seed round amounts rose. The median seed round size jumped to $6.6 million, reversing a downward trend in the first quarter and indicating growing confidence in early-stage investors.
- Private token sales remained stable, raising $410 million across just 15 deals, while public token sales declined 83%, raising $134 million across just 35 events.
- Infrastructure continues to dominate, with cryptocurrencies, mining and validation, and computing networks leading the way in terms of capital and investor interest.
- Consumer categories are showing signs of life, particularly in financial services and marketplaces, but funding and deal share remain relatively small.
- Funding trends this quarter suggest this is no longer a wide-ranging play, but rather a radical investment of conviction.
Market Overview: Capital Concentration
At first glance, the numbers seem contradictory: Web3 venture funding has surged, while the number of deals has plummeted. But against the backdrop of the broader correction we’ve tracked since 2024, the logic becomes clear: investors are shifting from broad coverage to deeper, more strategic bets, a shift that was solidified in Q2 2025.
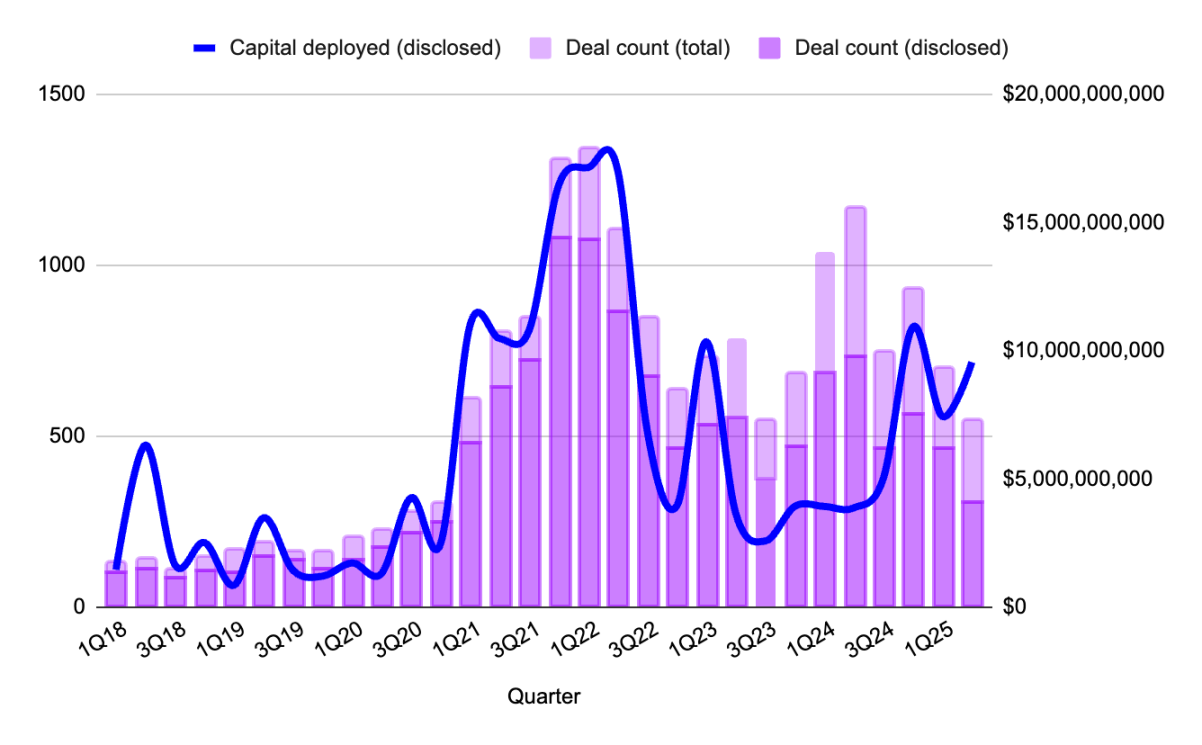
Figure 1: Web3 transaction volume and funding by quarter. Source: Outlier Ventures, Messari
Only 306 disclosed deals (transactions with published funding details) were recorded this quarter: the lowest level since mid-2023. However, funding soared to nearly $10 billion, nearly 30% higher than the previous quarter, without any outliers. Rather than seeing a single, outsized deal distorting the data, we saw a dense concentration of funding rounds between $50 million and $250 million, focused on strategic areas like Rollup infrastructure and validator liquidity. Funding this quarter was characterized by fewer bets, larger rounds, and higher barriers to entry.
The result is a market that feels smaller, but also more serious. In the post-megafund environment, investors aren't chasing every pitch deck; they're weighing narrative, protocol dependencies, and distribution advantages. You no longer get funded because you're promising; you get funded because you're indispensable.
Deal Stages of Web3 Startup Funding: Series A Returns
After a year of neglect, Series A funding is back in the spotlight.
The median Series A round size climbed to $17.6 million, the highest level since early 2022, with 27 deals raising a total of $420 million. These are no longer “pre-Series B” rounds masquerading as Series As; they are precise, prudent allocations of capital to companies with strong product-market fit (PMF), typically with growing revenue and well-established token mechanics.
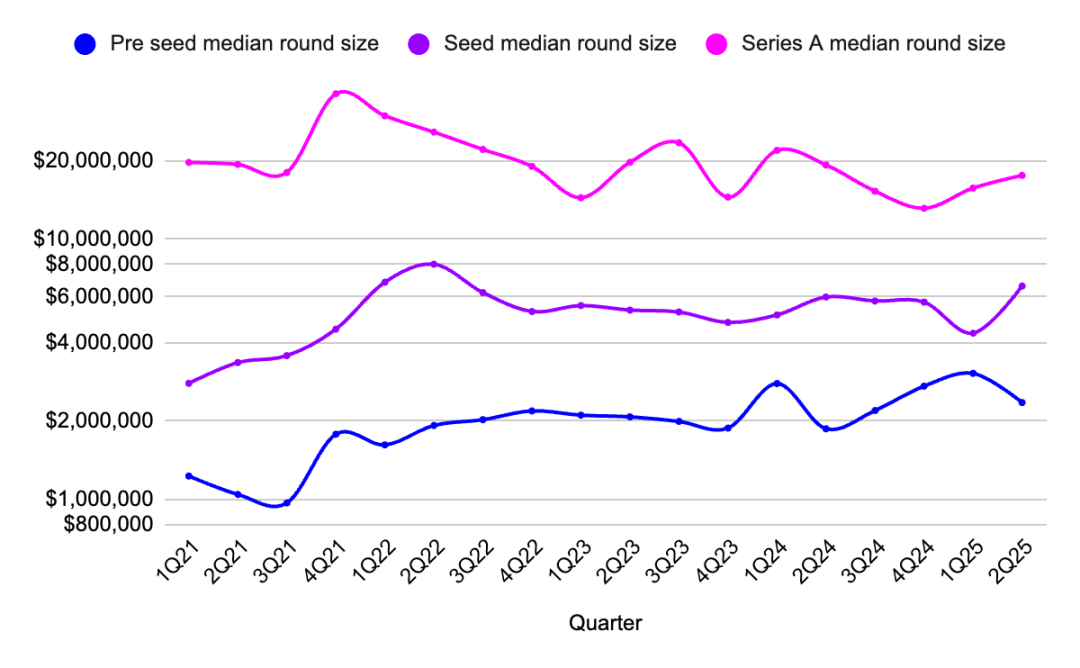
Figure 2: Quarterly changes in median round size across pre-seed, seed, and Series A rounds. Source: Outlier Ventures, Messari
Seed rounds also rebounded, with the median seed round size rising to $6.6 million, while the total number of deals saw a slight increase. This suggests a return of investor interest in early-stage ventures, at least in hot sectors like AI-native infrastructure or validator tools. Meanwhile, pre-seed rounds remained stable, with a median size of $2.35 million, confirming what we've seen over the past year: early-stage projects are still here.
In 2024, capital is concentrated between the optimism of the pre-seed stage and the maturity of Series B and beyond. Series A was once the place where faith died, but the venture market won't remain stagnant forever. Infrastructure takes time to build, and scaling takes time, too. That moment has arrived now.
Infrastructure investment dominates Web3 capital flows
This quarter’s map of Web3 categories weighted by capitalization looks like a blueprint for the post-consumer transition.
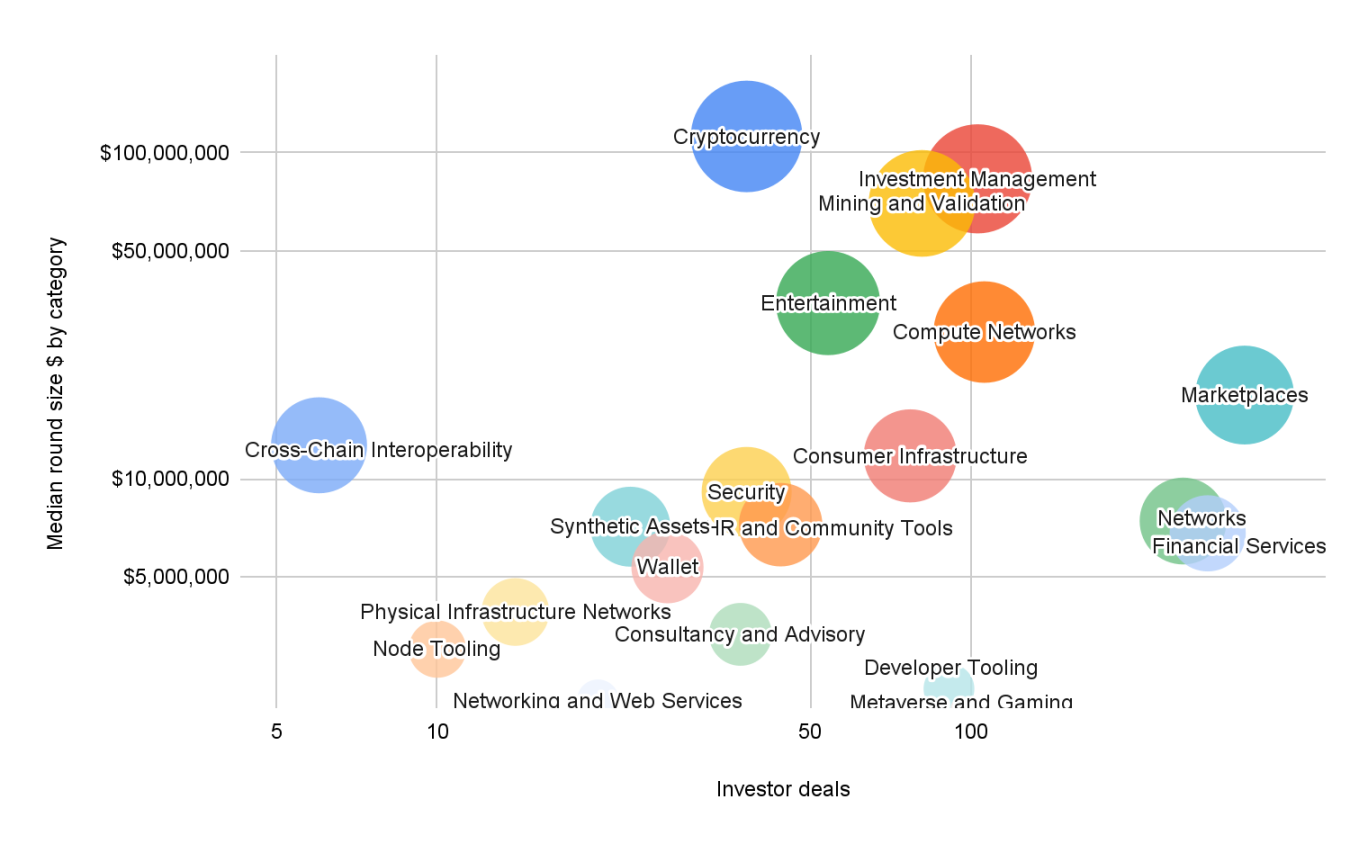
Figure 3: Average funding stage and round size by category, Q1 2025. Source: Outlier Ventures, Messari
Note: "Investor Deals" refers to the total number of investor engagements within a given category, not the number of unique investors. If a single investor participated in three financings, that would be counted as three investor deals.
The largest funding rounds occurred in the infrastructure (median $112 million), mining and validation (median $83 million), and computational networks (median $70 million) sectors. These aren't speculative tokens; rather, they're the infrastructure supporting validator networks, modular blockspaces, and AI-aligned consensus systems. This foundational layer defines the long-term blockchain investment strategy. The investor logic is clear: support the underlying infrastructure and then rapidly develop the application layer.
Other prominent infrastructure sectors include consumer infrastructure (median $11.7 million) and asset management (median $83 million). These categories sit at the intersection of infrastructure and user experience (UX), representing high-functioning products with technical depth and long-term composability.
On the other hand, developer tools again attracted strong interest (91 investor deals), but with smaller funding rounds. This is a familiar narrative for this long-tail, low-capex sector. But it remains a playground for early-stage teams and those willing to participate in grants and token options.
Financial Services, Entertainment, and Marketplaces all saw healthy deal counts and moderate median round sizes ($6 million to $18 million), indicating steady yet cautious investor interest. However, deal volume is far from the levels seen in 2021-2022. Investors haven't lost interest in consumer applications; they're simply waiting for new products to emerge.
Token Fundraising in Q2 2025: Private and Public Offerings
After a booming first quarter, token financing entered a quieter phase in the second quarter, but this shift felt more like a reallocation than a retreat.
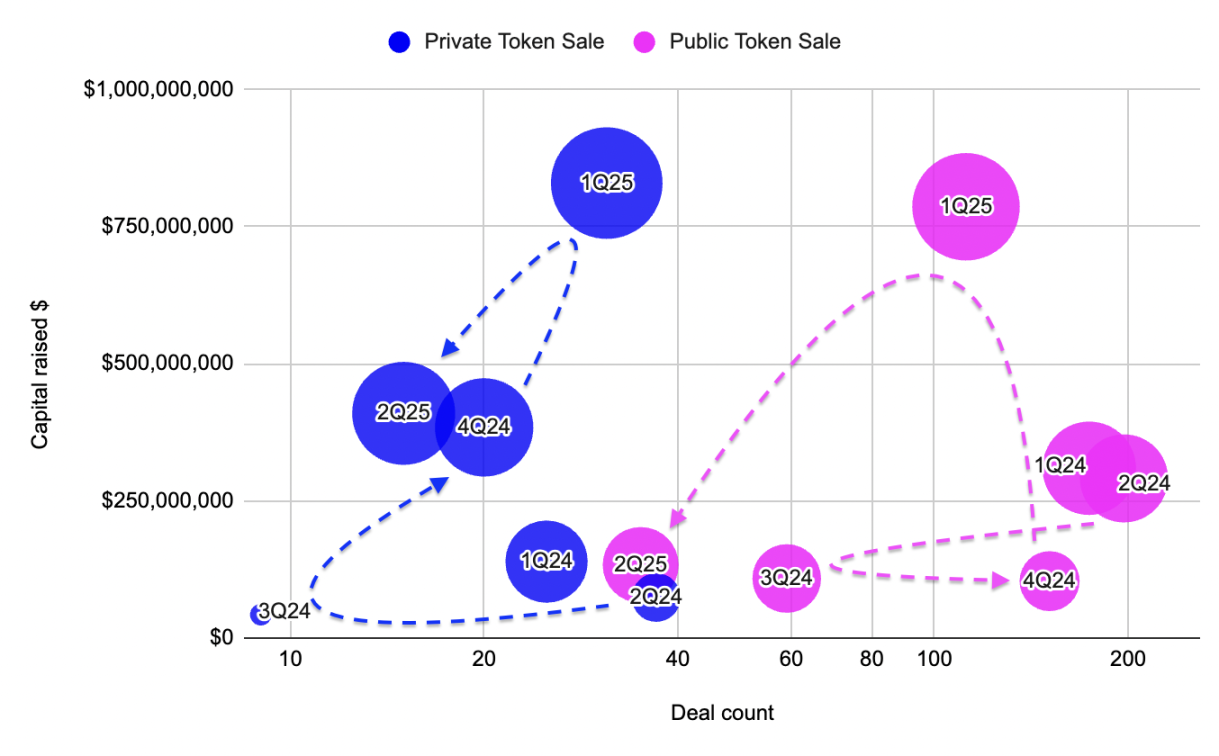
Figure 4: Comparison of private and public token sales in terms of funding and number of deals from 2022 to 2024. Source: Outlier Ventures, Messari
Private token sales raised $410 million across just 15 deals, with a median round size of $29.3 million, the highest level so far in 2021. This growth in high-value private allocations highlights the current Web3 fundraising environment: consistency and strategic partnerships are more important than hype. These aren't hype-driven memecoins or utility tokens disguised as protocols, but rather validator consortiums, L2 treasuries, and modular Rollup ecosystems quietly consolidating liquidity.
In contrast, public token sales collapsed. Only 35 funding rounds were completed, compared to 112 in the first quarter, totaling just $134 million. The median funding round size halved. Even offerings popular with retail investors struggled to attract attention, with the majority of trading volume concentrated in a handful of high-profile projects. Furthermore, market sentiment felt more like wait-and-see than bearish, a wait-and-see stance rather than a full-scale retreat.
The divergence between private and public sales continues a trend tracked since late 2023. Public token issuance surged when the market was hot, but private rounds reflect consistency, not hype.
Summarize
Investors are looking for clearer narratives, more solid infrastructure, and builders who understand how to navigate this new financing environment.
If 2024 is the year of recovery and restructuring, the second quarter of 2025 feels like the year of quiet execution.
Capital is flowing, but only to a few. Deal flow is declining, but funding rounds are rising. Infrastructure continues to win, but not out of bias, and without a major ideological shift.
The path is narrower for founders, but not unviable, early-stage deals are still happening, and Series A rounds are back. Private token sales once again have a real seat at the table, as long as they align with strategic, scalable, and protocol-dependent goals.
In short: We’ve left the hype cycle behind. It’s a slow, accelerated climb toward critical infrastructure and enduring applications.
The conclusion is simple: this market doesn’t need more hype cycles, it needs inevitability.
You May Also Like

Dramatic Spot Crypto ETF Outflows Rock US Market

Remittix Success Leads To Rewarding Presale Investors With 300% Bonus – Here’s How To Get Involved
