Render crypto (RNDR/USDT) holds above $7 as compression builds before the next move

Market action on Render crypto (RNDRUSDT) is coiling around the $7 zone, with price testing a key decision area that will define whether this is just a pause or the end of the correction.
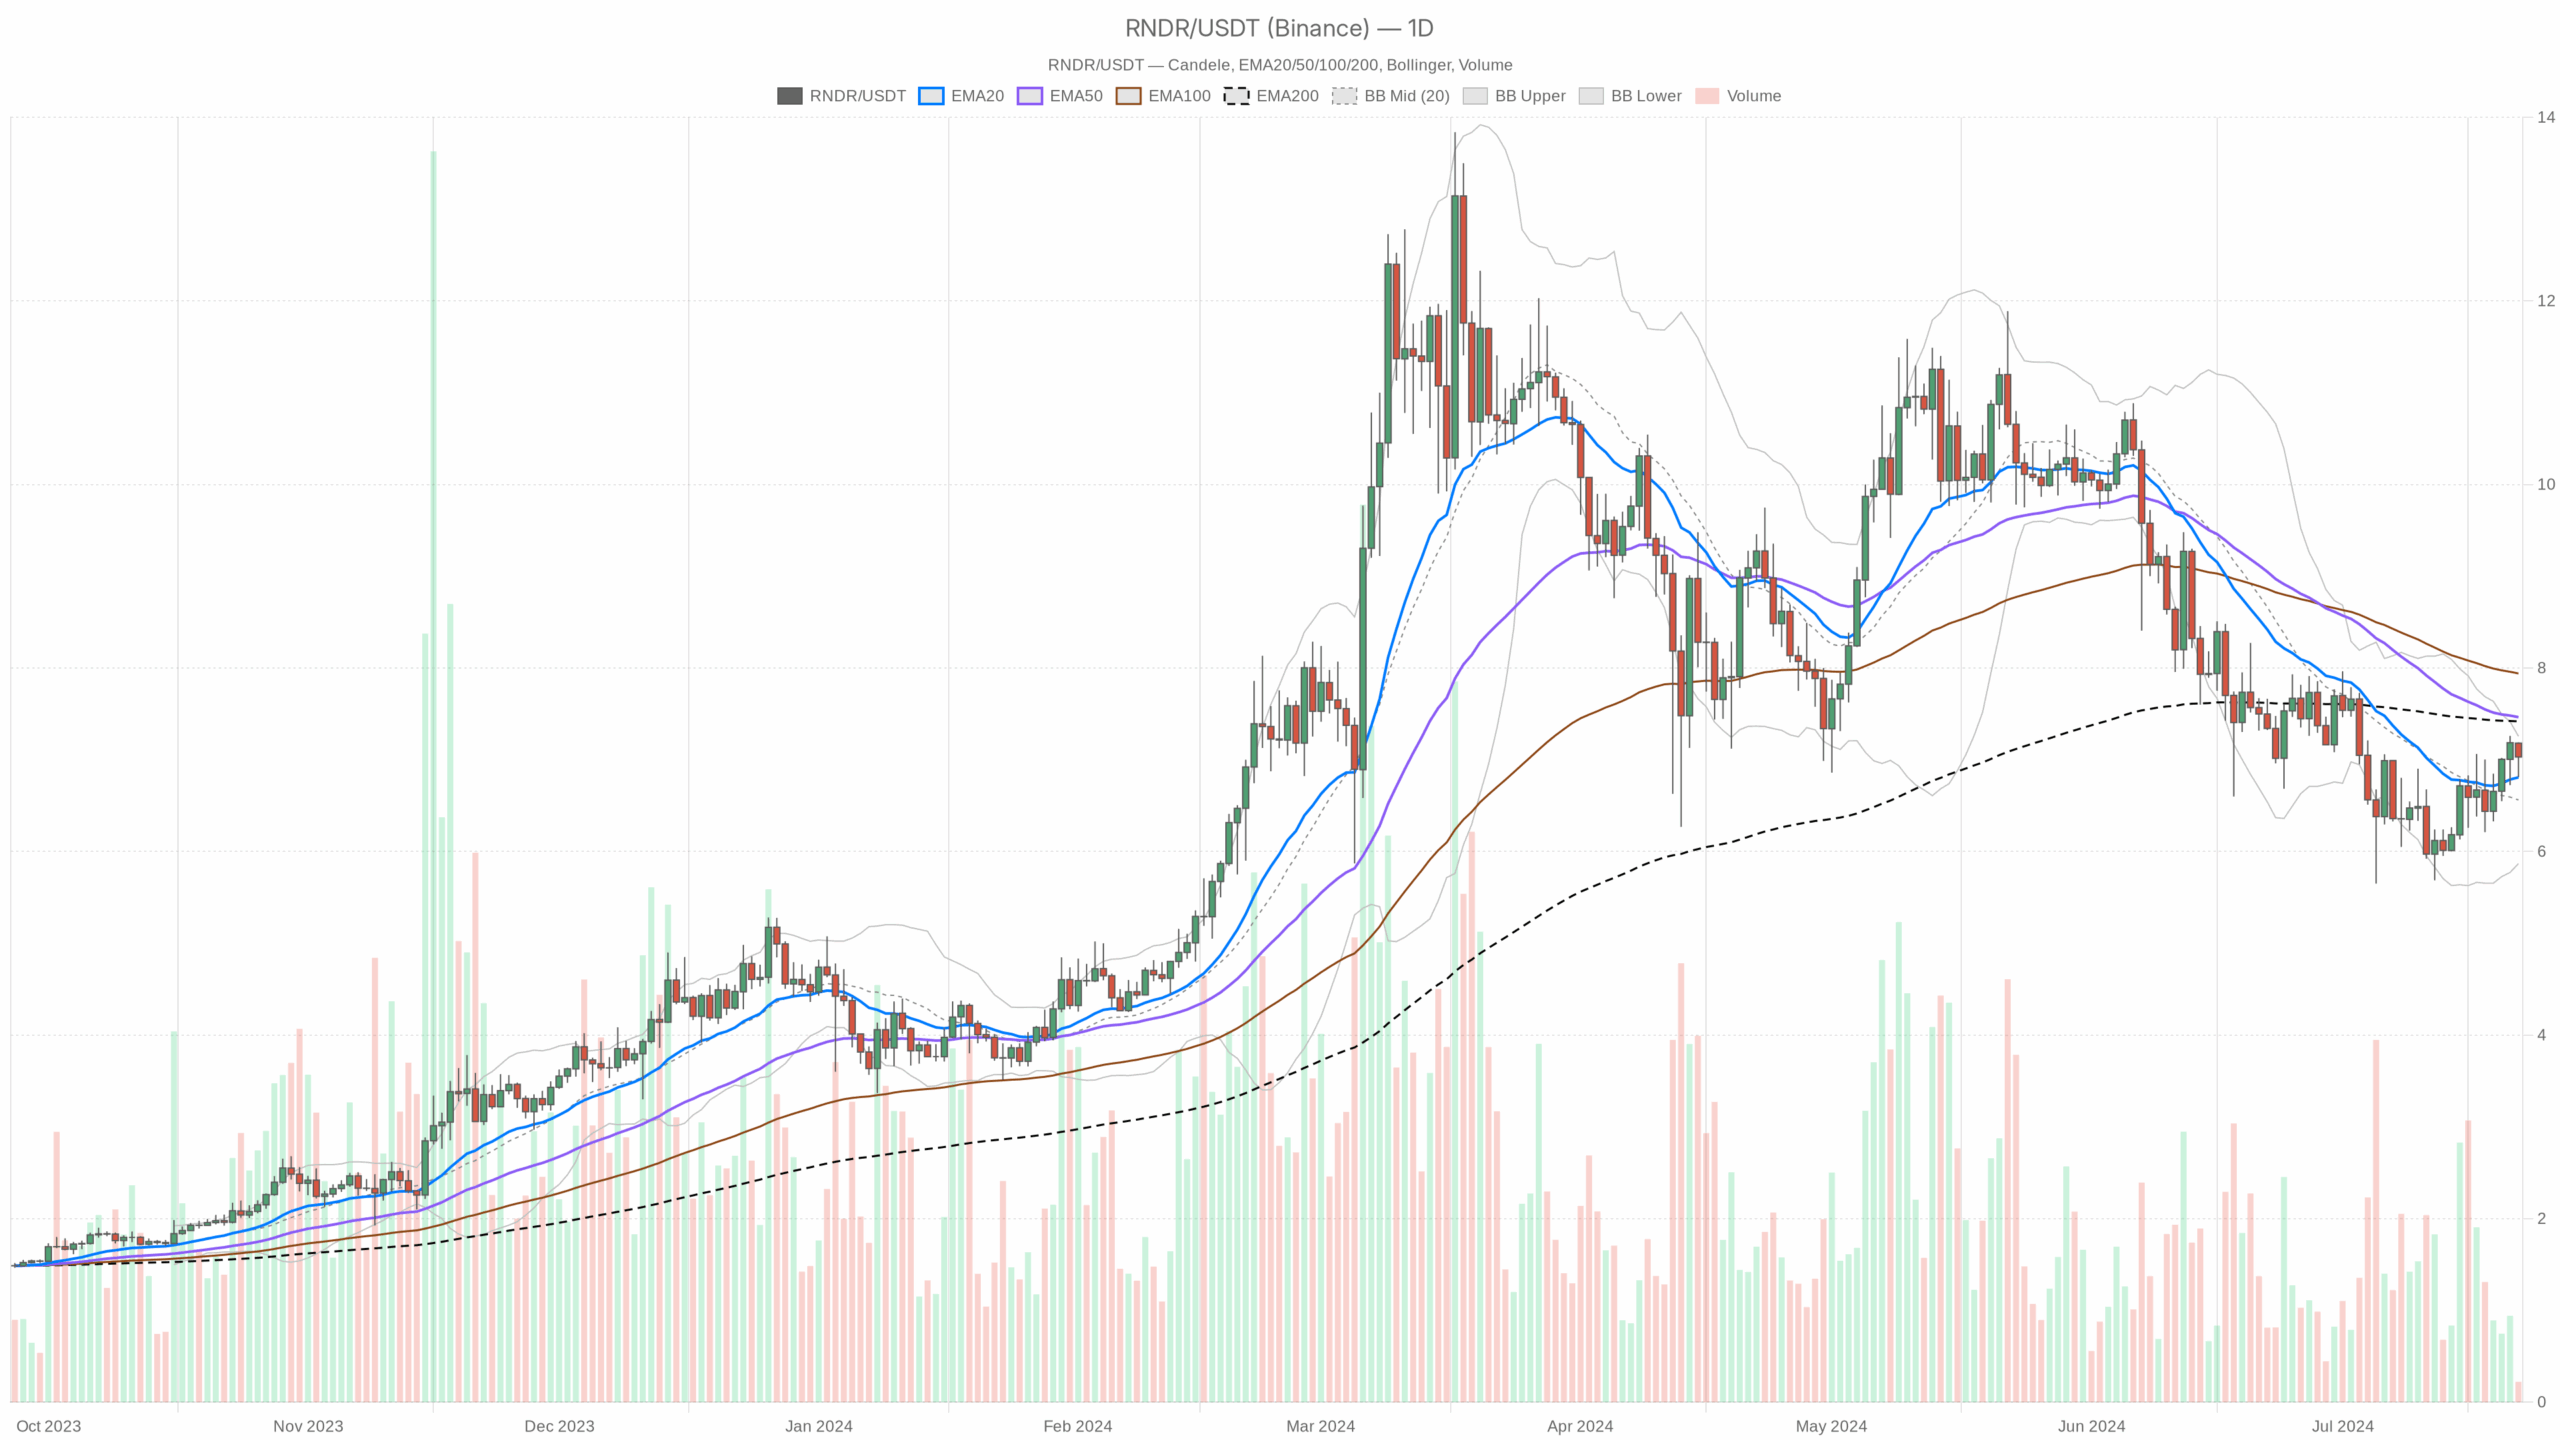 RNDR/USDT — daily chart with candlesticks, EMA20/EMA50 and volume.
Daily Chart (D1): Macro Bias – Slight Bullish Lean Inside a Neutral Regime
Trend and EMAs
– Price: $7.03
– EMA20: $6.81
– EMA50: $7.46
– EMA200: $7.42
Price is now back above the 20-day EMA, but still below both the 50-day and 200-day. That puts RNDR in a short-term rebound within a medium-term corrective structure. The 50 and 200 EMAs are clustered above price, effectively creating a supply zone between roughly $7.40–7.50. Until RNDR can break and hold above that band, the bigger trend is still in repair, not fully bullish.
Interpretation: The daily trend is attempting to turn up from a neutral or corrective state. Bulls have regained some control in the short term (above the 20-day), but the real test sits higher, near the 50 and 200 EMAs. That is the line between a bounce and a trend resumption.
RSI (14) – Mid-Range, No Extremes
– RSI14: 51.23
Daily RSI is parked almost exactly in the middle of the range. There is no overbought or oversold condition, and no obvious divergence from price in the numbers you have provided.
Interpretation: Momentum is balanced. The market is not stretched either way, which leaves room for a sizeable move in both directions. Direction will be dictated more by structure (breakouts or breakdowns) than by mean-reversion signals from RSI right now.
MACD – Bearish Phase Losing Steam
– MACD line: -0.17
– Signal line: -0.33
– Histogram: +0.16
The MACD is still below zero but the line has crossed above the signal, turning the histogram positive.
Interpretation: The prior bearish momentum wave is fading, and buyers are starting to push back. It is an early bullish momentum shift, but because MACD is still negative overall, this looks more like a counter-trend rally within a broader corrective cycle than a confirmed new uptrend.
Bollinger Bands – Trading in the Upper Half
– Mid-band (20-day basis): $6.56
– Upper band: $7.26
– Lower band: $5.87
– Price: $7.03
RNDR is trading above the mid-band and below the upper band, in the upper half of the daily volatility envelope.
Interpretation: Price is leaning to the bullish side of its recent range but has not triggered a volatility breakout. This fits the idea of a controlled grind higher rather than an explosive move. However, if price starts hugging or closing above the upper band with expanding range, that is when a trend leg can develop.
ATR (14) – Room for $0.50+ Daily Swings
– ATR14: $0.53
Daily ATR above half a dollar is substantial relative to a $7 asset. You are looking at a typical daily swing of around 7–8%.
Interpretation: Volatility is elevated enough that normal noise can easily hit nearby levels both above and below spot. Moreover, position sizing and stop placement need to respect that; tight stops inside a $0.50 band are more likely to be chopped out.
Daily Pivot Levels – Market Sitting Right on the Balance Point
– Pivot point (PP): $7.01
– First resistance (R1): $7.21
– First support (S1): $6.83
Spot is almost exactly at the daily pivot, with R1 just above the upper Bollinger band mid-zone and S1 close to the 20-day EMA.
Interpretation: The market is literally balanced at its reference level. A push through $7.21 would signal intraday strength aligning with the short-term bullish tone. A move back below $6.83 would show buyers losing grip and re-opening a path back toward the mid-band and lower support.
Daily bias: Neutral regime with a slight bullish tilt, as long as price holds above the 20-day EMA and daily pivot. The bigger trend is not fully repaired while RNDR trades below $7.40–7.50.
1-Hour Chart (H1): Short-Term Bulls in Control, But Momentum Is Pausing
Trend and EMAs
– Price: $7.03
– EMA20: $7.00
– EMA50: $6.91
– EMA200: $6.65
– Regime (system): bullish
On the hourly, price is stacked cleanly above all three EMAs, and the fast averages (20 and 50) are above the 200.
Interpretation: Intraday structure is clearly bullish. Dips toward the 20-hour EMA around $7 and especially the 50-hour near $6.90 are being defended. This timeframe is supporting the daily attempt to turn higher, not fighting it.
RSI (14) – Mildly Positive
– RSI14: 52.48
Hourly RSI sits just above neutral, slightly favoring the buy side but not overstretched in the slightest.
Interpretation: Short-term momentum is modestly with the bulls. There is room for continuation higher before any overbought concerns appear on this timeframe.
MACD – Flattening Out
– MACD line: 0.04
– Signal line: 0.05
– Histogram: -0.01
MACD on H1 is just above zero, with the line essentially sitting on the signal.
Interpretation: The prior intraday impulse higher has cooled off. Momentum is pausing rather than reversing. This often precedes either a consolidation before another leg up, or a slow fade if buyers fail to step back in around support.
Bollinger Bands – Contained Within the Range
– Mid-band: $6.97
– Upper band: $7.22
– Lower band: $6.73
– Price: $7.03
Price is just above the mid-band, nowhere near the extremes.
Interpretation: Short-term volatility is contained, and RNDR is trading quietly inside its intraday range. There is no squeeze and no breakout, just a steady drift higher above trend support.
ATR (14) – Intraday Swings Around $0.20
– ATR14: $0.19
Hourly ATR near $0.19 means average hourly bars can swing roughly 2.5–3% at current prices.
Interpretation: For traders on this timeframe, normal intraday noise can test both the pivot and nearby EMAs within a couple of hours. Therefore, entries too tight around $7 can get whipsawed easily.
Hourly Pivot Levels
– Pivot point (PP): $6.99
– First resistance (R1): $7.14
– First support (S1): $6.88
Spot is trading slightly above the hourly pivot, with R1 in line with the upper Bollinger band area and S1 just under the 50-hour EMA.
Interpretation: As long as RNDR holds above $6.99 and especially above $6.88, intraday bulls maintain the upper hand. A clean break over $7.14 would indicate a fresh push toward daily resistance zones.
15-Minute Chart (M15): Execution Context – Micro-Tight Range
Trend and EMAs
– Price: $7.03
– EMA20: $7.02
– EMA50: $7.02
– EMA200: $6.90
– Regime (system): bullish
The 15-minute EMAs are flat and overlapping around $7.02, with price pinned right on them.
Interpretation: Very short term, RNDR is in a tight consolidation with a slight bullish bias (above the 200 EMA). This is a classic compression zone that usually resolves with a directional push. Right now, there is no clear micro-timeframe advantage to either side.
RSI (14) – Dead Center
– RSI14: 50.29
Interpretation: RSI is completely neutral on the 15-minute chart. There is no edge from momentum here; structure and levels matter more than indicators in this micro window.
MACD – Flatline
– MACD line: -0.02
– Signal line: -0.02
– Histogram: 0.00
Interpretation: Momentum is essentially zero on this timeframe. RNDR is coiling, waiting for a fresh impulse.
Bollinger Bands and Pivots – Micro-Ranges
– Mid-band: $7.05
– Upper band: $7.28
– Lower band: $6.83
– Pivot point (PP): $7.05
– R1: $7.08
– S1: $7.00
Price is just below the mid-band and the 15-minute pivot, with extremely tight R1 and S1 levels.
Interpretation: Short-term scalpers are trading a narrow $7.00–7.08 range. A break of either side is likely to feed into the 1-hour structure quite quickly. On its own, however, the 15-minute chart is just noise around the key $7 area.
Cross-Timeframe Read: Where Do the Signals Agree, Where Do They Clash?
– Daily: Neutral regime with a slight bullish tilt; price above EMA20 but below EMA50 and EMA200.
– 1-hour: Clearly bullish; price above all key EMAs, healthy structure.
– 15-minute: Micro-consolidation just above support, no momentum edge.
The tension is straightforward: short-term timeframes are bullish, the higher timeframe is still undecided. Intraday traders are pressing the long side, but higher-timeframe players have not yet validated a full trend resumption above the $7.40–7.50 ceiling.
Overlay this on macro conditions: total crypto market cap is barely up, volumes are down sharply over 24 hours, BTC dominance is high, and the fear and greed index sits in Extreme Fear. That is a backdrop where altcoin breakouts often fail on first attempts. So while the microstructure of RNDR looks constructive, the broader environment still encourages fast profit-taking rather than extended trend-chasing.
Main Scenario for Render crypto (RNDRUSDT)
Based on the daily chart, the primary scenario is neutral with a constructive, slightly bullish bias. RNDR is trying to base and push higher, but it has not yet cleared the overhead supply that would mark a clean bullish trend continuation.
Bullish Scenario
In the bullish path, the current consolidation above $7 acts as a launchpad.
Key steps:
1. Hold above daily EMA20 and S1
As long as price holds above roughly $6.80–6.83 (daily S1 and near EMA20), the short-term bullish structure remains intact. Any dip into that area that finds buyers would reinforce the view that RNDR is accumulating, not distributing.
2. Break and hold above $7.21 then $7.40–7.50
– First trigger: a decisive move and close above $7.21 (daily R1 and local resistance) with rising hourly momentum.
– Confirmation: follow-through that pushes price through the $7.40–7.50 band where the 50-day and 200-day EMAs sit.
In this bullish script, daily RSI grinds higher toward the 60s, MACD continues to rise and eventually crosses back above zero, and price starts to lean on or above the upper Bollinger band instead of oscillating in the middle.
What invalidates the bullish case?
A clean break below $6.80 with daily closes under the 20-day EMA would undermine the idea of an early upturn and point to a deeper correction. If daily MACD rolls back down and widens negatively again, that would confirm bulls have lost the momentum fight.
Bearish Scenario
In the bearish path, this bounce above the 20-day EMA is just a relief rally inside a larger distribution phase.
Key steps:
1. Failure at $7.21–7.40
RNDR stalls between the daily R1 around $7.21 and the EMA cluster at $7.40–7.50. Multiple failed intraday pushes into that zone, combined with weakening hourly MACD and RSI, would hint that sellers are using strength to exit.
2. Break back below $6.83 and the 20-day EMA
A sustained move under $6.83 and the 20-day EMA flips the short-term structure back in favor of the bears. From there, the mid Bollinger band around $6.56 becomes the first downside magnet, with risk of a deeper move toward the lower band near $5.87 if macro sentiment deteriorates.
In this scenario, daily RSI drifts back toward the 40s, MACD fails to reclaim zero and hooks lower, and price shifts from trading in the upper half of the bands to hugging the mid or lower band.
What invalidates the bearish case?
A strong breakout above $7.50 with expanding volume, daily closes above the 50 and 200 EMAs, and MACD pushing toward or above zero would make the “just a bounce” narrative obsolete. Bears lose the argument once RNDR shows it can live comfortably above that confluence of resistance.
Positioning, Risk, and Uncertainty
RNDR is in a classic decision zone: short-term charts lean bullish, the daily chart is trying to turn the corner, but the broader crypto market is still risk-averse. That mix usually favors range trading with fast reaction rather than strong directional conviction.
For directional exposure, the key questions are:
- Are you betting on a structural breakout above the daily EMA cluster ($7.40–7.50), or just playing the range between daily S1 and R1?
- Does your risk management account for a daily ATR of about $0.53 and intraday ATR around $0.19?
Those swings are large enough that poorly placed stops can be hit even if your broader directional idea is correct. Moreover, uncertainty remains high: macro news flow on regulation, ongoing political noise around crypto, and a fearful sentiment backdrop can all change the tape quickly. RNDR’s setup is constructive, but it is operating in a market that is still more defensive than enthusiastic. In that kind of environment, levels and confirmation matter more than narratives.
If you want to monitor markets with professional charting tools and real-time data, you can open an account on Investing using our partner link:
Open your Investing.com account
This section contains a sponsored affiliate link. We may earn a commission at no additional cost to you.
Disclaimer: This analysis is for informational and educational purposes only and is not a recommendation to buy or sell any asset. Always perform your own research and consider your risk tolerance before making trading decisions.
In summary, RNDR is compressing just above key support, with intraday bulls active but higher timeframes still mending. The next decisive expansion, up or down, will likely be driven by how price behaves around the $7.21 and $7.40–7.50 zones against a still cautious crypto backdrop.
You May Also Like

Horror Thriller ‘Bring Her Back’ Gets HBO Max Premiere Date

While Shiba Inu and Turbo Chase Price, 63% APY Staking Puts APEMARS at the Forefront of the Best Meme Coin Presale 2026 – Stage 6 Ends in 3 Days!