Nvidia’s rally keeps pushing price toward the $200 zone, even as its earnings multiple continues to compress on the weekly view. Meanwhile, the daily structure Nvidia’s rally keeps pushing price toward the $200 zone, even as its earnings multiple continues to compress on the weekly view. Meanwhile, the daily structure

NVDA Stock Forecast: $200 Zone Becomes Bull Magnet

2 min read

Nvidia’s rally keeps pushing price toward the $200 zone, even as its earnings multiple continues to compress on the weekly view. Meanwhile, the daily structure shows a tightening flag setup, which keeps the breakout scenario in focus.

NVDA price climbs as valuation multiple contracts

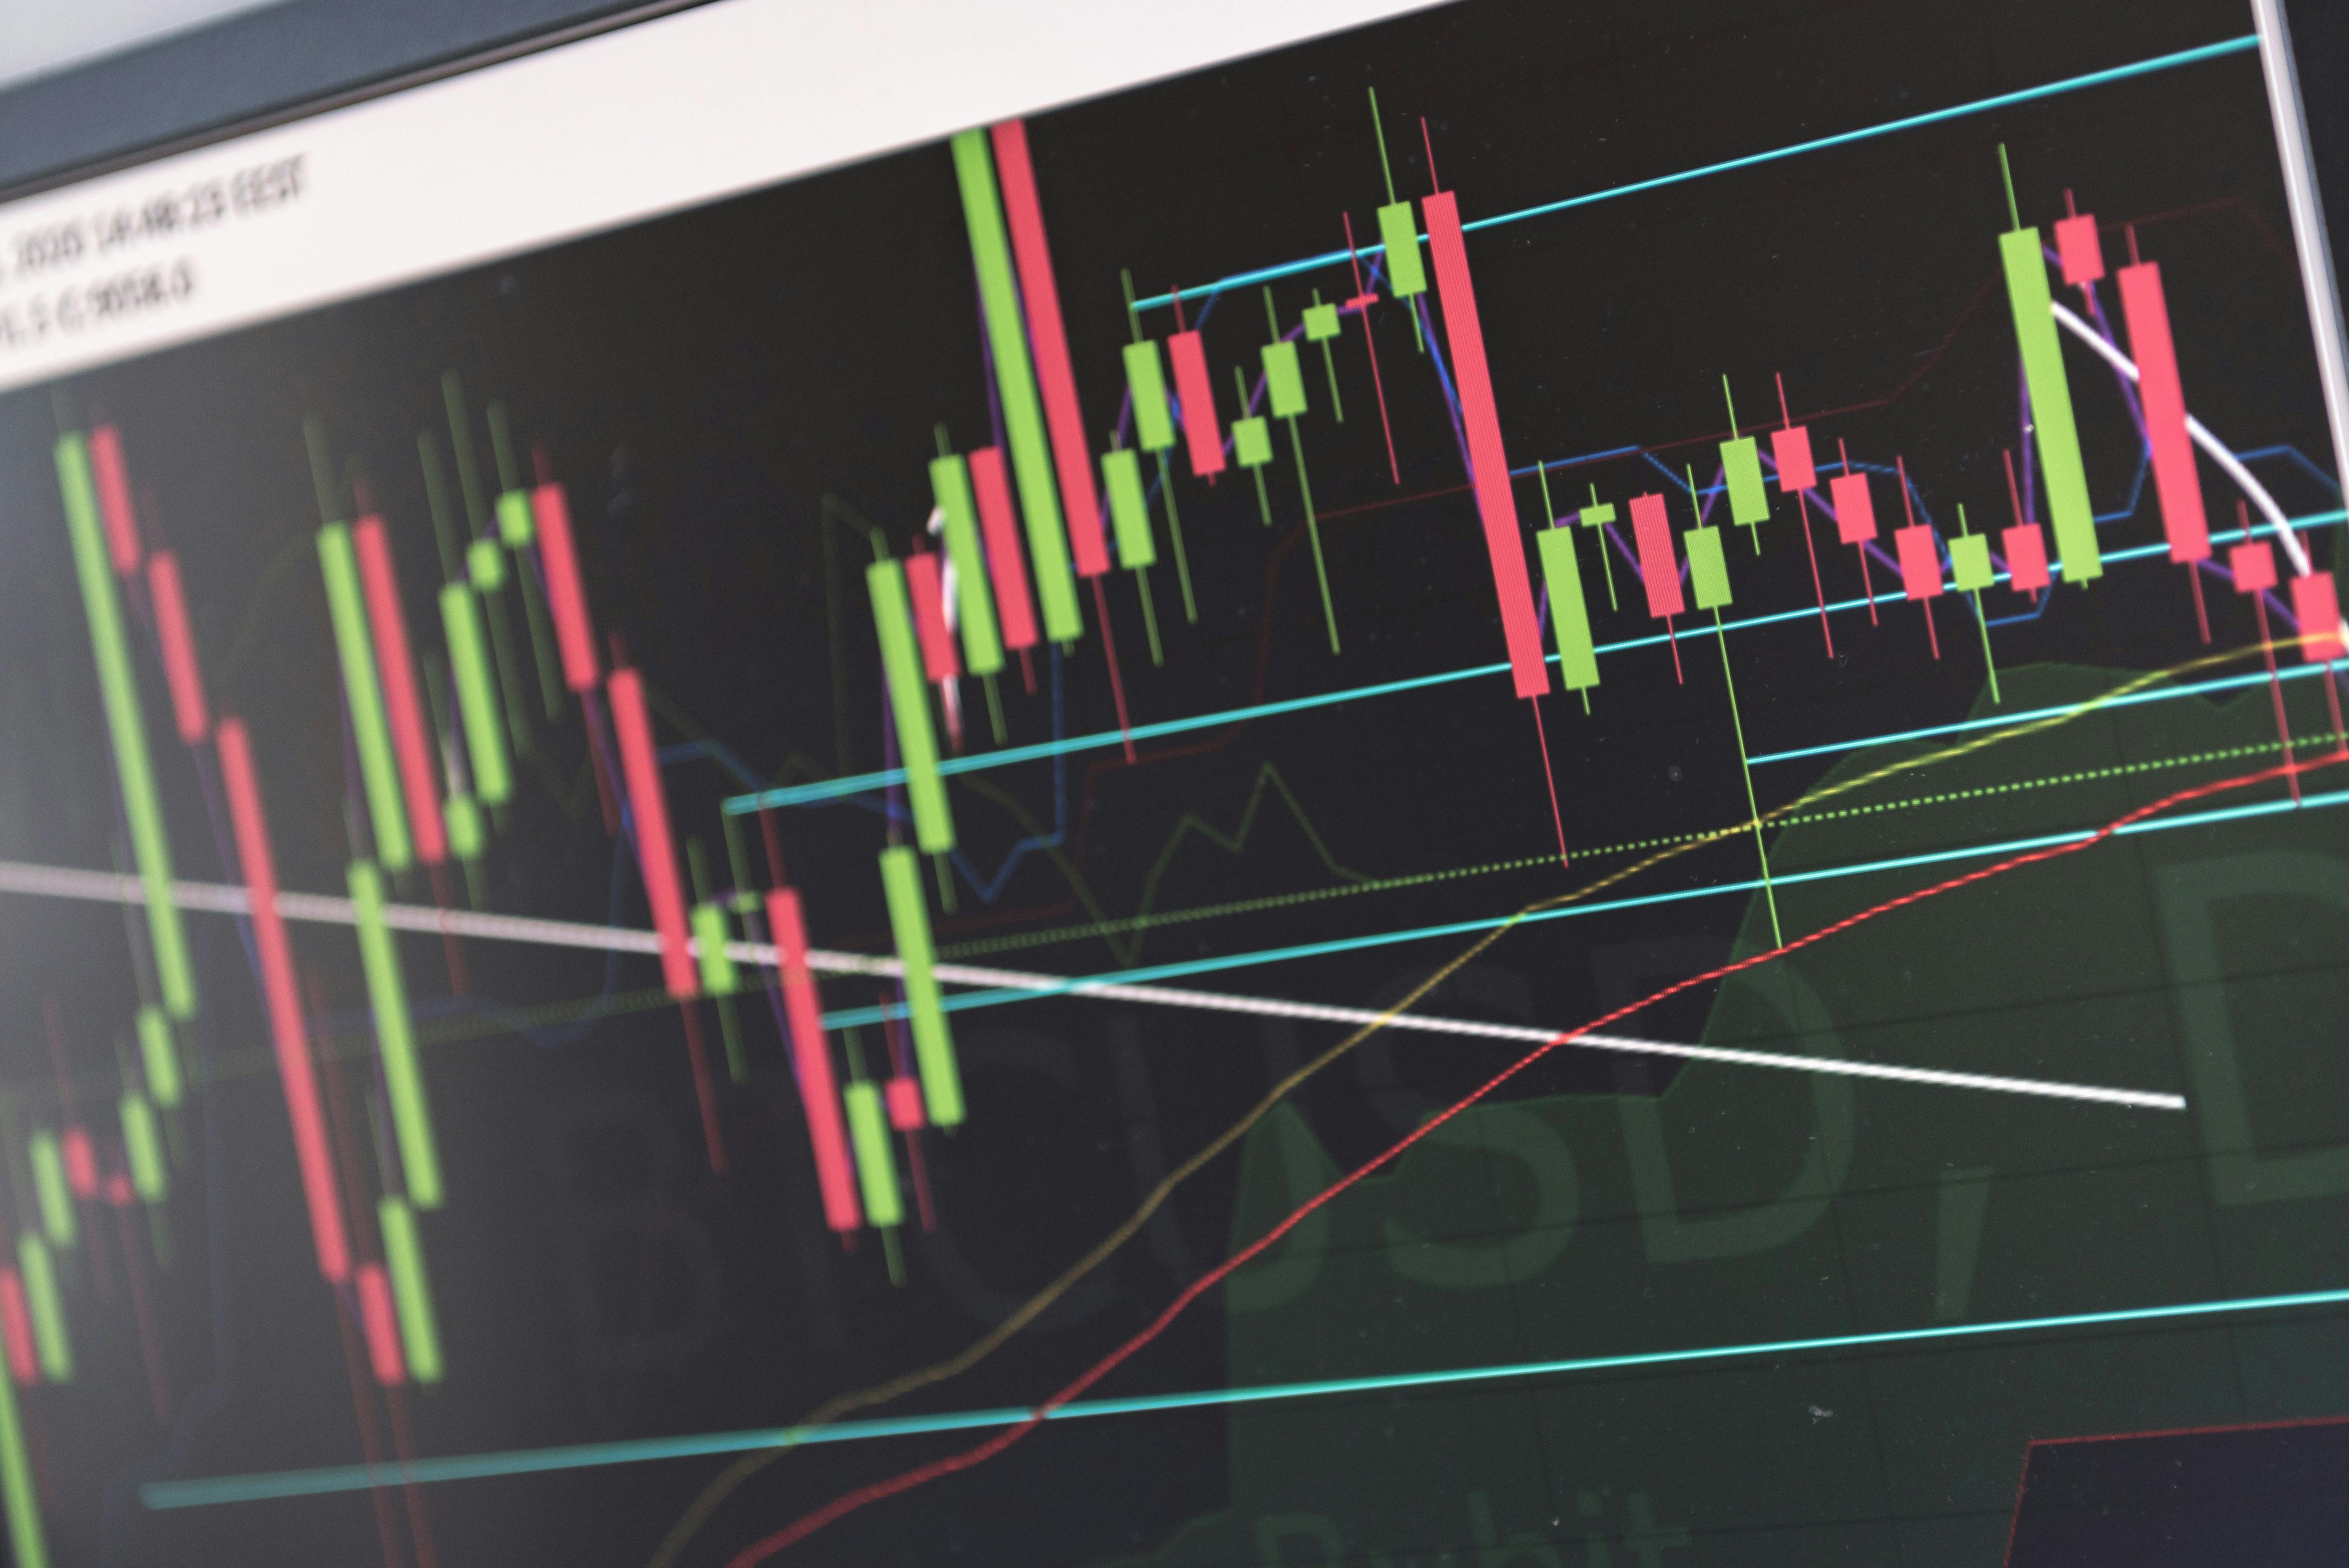
Nvidia shares continued to trade near record levels on the weekly chart, with price holding around the $190–$191 area after a strong multi-month advance. Since early 2024, NVDA has moved steadily higher, printing higher highs and higher lows, while momentum stayed intact despite periodic pullbacks. As a result, the broader trend remains firmly upward.

NVDA Stock Forecast: $200 Zone Becomes Bull Magnet

NVIDIA Weekly Chart. Source: TrendSpider

At the same time, valuation metrics moved in the opposite direction. Nvidia’s earnings multiple has steadily declined from extreme levels seen in 2023, when the stock traded above 150x earnings, toward the mid-40x range shown on the chart. Therefore, price appreciation has outpaced multiple expansion, meaning earnings growth absorbed much of the valuation pressure. This divergence stands out because price strength continued even as the multiple compressed, signaling that fundamentals, not just sentiment, supported the move.

NVDA structure points to a breakout attempt toward higher targets

The chart highlights a tightening structure that continues to favor upside continuation. NVDA trades within a rising trend that has held since mid-2024, while pullbacks repeatedly respect the same ascending support line. As a result, downside attempts lose momentum quickly, and price compresses rather than breaking lower.

NVDA Daily Chart. Source: StockCharts / X

At the same time, a short, downward sloping resistance line caps recent advances. Price keeps pressing into that line, which suggests sellers are absorbing demand at progressively higher levels. Therefore, the pattern resembles a consolidation within an existing uptrend rather than a distribution phase. This behavior aligns with a flag-type structure, where volatility contracts before a directional move.

Momentum also supports the setup. The RSI holds in a neutral to constructive zone, avoiding both overbought and deeply oversold conditions. That balance leaves room for expansion if resistance gives way. If price clears the descending trendline decisively, the structure opens the path toward higher extension levels, with the $200 area acting as the first psychological zone, followed by the potential for fresh all-time highs if continuation holds.

Disclaimer: The articles reposted on this site are sourced from public platforms and are provided for informational purposes only. They do not necessarily reflect the views of MEXC. All rights remain with the original authors. If you believe any content infringes on third-party rights, please contact service@support.mexc.com for removal. MEXC makes no guarantees regarding the accuracy, completeness, or timeliness of the content and is not responsible for any actions taken based on the information provided. The content does not constitute financial, legal, or other professional advice, nor should it be considered a recommendation or endorsement by MEXC.

You May Also Like

Top 3 Cryptos That Could Turn $100 Into $5,000 in 2025 – Including This Meme-to-Earn Token’s Game-Changing Potential

Top 3 Cryptos That Could Turn $100 Into $5,000 in 2025 – Including This Meme-to-Earn Token’s Game-Changing Potential

Discover 3 cryptos with explosive growth potential - Ethereum, Shiba Inu, and MAGAX. Here’s why early investors are eyeing them for 2025.
Share
Blockchainreporter2025/09/18 07:45
OFAC Designates Two Iranian Finance Facilitators For Crypto Shadow Banking

OFAC Designates Two Iranian Finance Facilitators For Crypto Shadow Banking

The Department of the Treasury’s Office of Foreign Assets Control (OFAC) sanctioned two Iranian financial facilitators for coordinating over $100 million worth of cryptocurrency in oil sales for the Iranian government, a September 16 press release shows. OFAC Sanctions Iranian Nationals According to the Tuesday press release, Iranian nationals Alireza Derakhshan and Arash Estaki Alivand “used a network of front companies in multiple foreign jurisdictions” to transfer the digital assets. OFAC alleges that Alivand and Derakhshan’s transfers also involved the sale of Iranian oil that benefited Iran’s Islamic Revolutionary Guard Corps-Qods Force (IRGC-QF) and the Ministry of Defense and Armed Forces Logistics (MODAFL). IRGC-QF and MODAFL then used the proceeds to support regional proxy terrorist organizations and strengthen their advanced weapons systems, including ballistic missiles. U.S. officials say the move targets shadow banking in the region, where illicit financial actors use overseas money laundering and digital assets to evade sanctions. “Iranian entities rely on shadow banking networks to evade sanctions and move millions through the international financial system,” said Under Secretary of the Treasury for Terrorism and Financial Intelligence John K. Hurley. “Under President Trump’s leadership, we will continue to disrupt these key financial streams that fund Iran’s weapons programs and malign activities in the Middle East and beyond,” he continued. Dozens Designated In Shadow Banking Scandal Both Alivand and Derakhshan have been designated “for having materially assisted, sponsored, or provided financial, material, or technological support for, or goods or services to or in support of the IRGC-QF.” In addition to Alivand and Derakhshan, OFAC has sanctioned more than a dozen Hong Kong and United Arab Emirates-based entities and individuals tied to the network. According to the press release, the sanctioned entities may face civil or criminal penalties imposed as a result
Share
CryptoNews2025/09/18 11:18
SOL Price Prediction: Oversold Conditions Target $142 Recovery by March 2026

SOL Price Prediction: Oversold Conditions Target $142 Recovery by March 2026

Solana trades at $103.22 with RSI at 29.98 signaling oversold conditions. Technical analysis suggests potential bounce to $142 resistance within 6-8 weeks. (Read
Share
BlockChain News2026/02/03 17:58