

LayerZero (ZRO) Price Prediction 2026, 2027-2030
- Bullish ZRO price prediction for 2026 is $1.947 to $3.055.
- LayerZero (ZRO) price might reach $10 soon.
- Bearish ZRO price prediction for 2026 is $0.798.
In this LayerZero (ZRO) price prediction 2026, 2027-2030, we will analyze the price patterns of ZRO by using accurate trader-friendly technical analysis indicators and predict the future movement of the cryptocurrency.
|
TABLE OF CONTENTS
|
|
INTRODUCTION
|
|
|
LAYERZERO (ZRO) PRICE PREDICTION 2026
|
|
| LAYERZERO (ZRO) PRICE PREDICTION 2027, 2028-2030 |
| CONCLUSION |
| FAQ |
LayerZero (ZRO) Current Market Status
| Current Price | $1.89 |
| 24 – Hour Price Change | 10.37% Up |
| 24 – Hour Trading Volume | $142.95M |
| Market Cap | $632.73M |
| Circulating Supply | 333.85M ZRO |
| All – Time High | $7.53 (On December 06, 2024) |
| All – Time Low | $1.50 (On March 11, 2025 ) |
What is LayerZero (ZRO)
| TICKER | ZRO |
| BLOCKCHAIN | LayerZero |
| CATEGORY | Blockchain Interoperability Protocol. |
| LAUNCHED ON | June 20, 2024 |
| UTILITIES | Governance, security, gas fees & rewards |
LayerZero (ZRO) is an innovative blockchain interoperability protocol designed to enable seamless communication between different blockchain networks. It utilizes a unique approach by combining on-chain and off-chain components to provide a trustless, decentralized messaging layer. This allows for cross-chain token transfers, data sharing, and decentralized applications (dApps) to operate across multiple blockchains efficiently.
LayerZero aims to overcome the limitations of existing interoperability solutions by offering enhanced security, scalability, and flexibility. Its architecture includes a User Application (UA), Oracle, and Relayer, ensuring that messages are reliably transmitted between chains without relying on a single point of trust.
LayerZero 24H Technicals
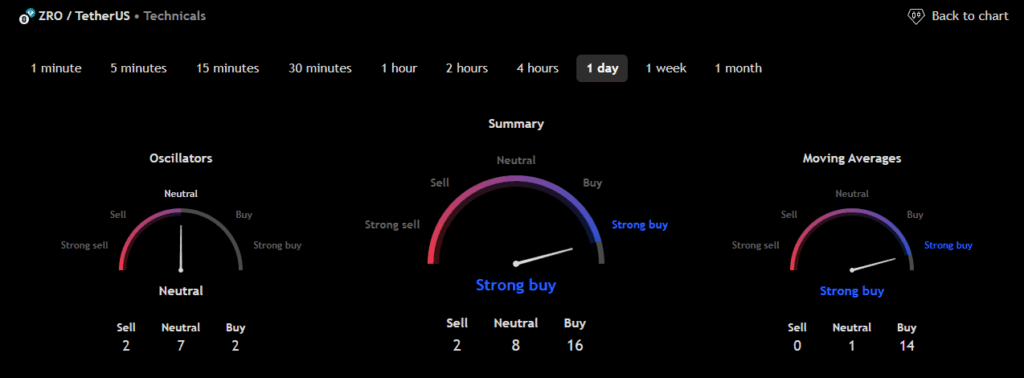 (Source: TradingView)
LayerZero (ZRO) Price Prediction 2026
LayerZero (ZRO) ranks 78th on CoinMarketCap in terms of its market capitalization. The overview of the LayerZero price prediction for 2026 is explained below with a daily time frame.
In the above chart, LayerZero (ZRO) laid out a Horizontal channel pattern. The Horizontal channel pattern is also known as the sideways trend. In general, the horizontal channel is formed during the price consolidation. In this pattern, the upper trendline, the line that connects the highs, and the lower trendline, the line that connects the lows, run horizontally parallel, and the price action is contained within it.
A horizontal channel is often regarded as one of the suitable patterns for timing the market, as the buying and selling points are in consolidation.
At the time of analysis, the price of LayerZero (ZRO) was recorded at $1.89. If the pattern trend continues, then the price of ZRO might reach the resistance levels of $1.926 and $3.192. If the trend reverses, then the price of ZRO may fall to the support of $1.524 and $1.198.
LayerZero (ZRO) Resistance and Support Levels
The chart given below elucidates the possible resistance and support levels of LayerZero (ZRO) in 2026.
From the above chart, we can analyze and identify the following as the resistance and support levels of LayerZero (ZRO) for 2026.
| Resistance Level 1 | $1.947 |
| Resistance Level 2 | $3.055 |
| Support Level 1 | $1.217 |
| Support Level 2 | $0.798 |
ZRO Resistance & Support Levels
LayerZero (ZRO) Price Prediction 2026 — RVOL, MA, and RSI
The technical analysis indicators, such as Relative Volume (RVOL), Moving Average (MA), and Relative Strength Index (RSI) of LayerZero (ZRO) are shown in the chart below.
From the readings on the chart above, we can make the following inferences regarding the current LayerZero (ZRO) market in 2026.
| INDICATOR | PURPOSE | READING | INFERENCE |
| 50-Day Moving Average (50MA) | Nature of the current trend by comparing the average price over 50 days | 50 MA = $1.433Price = $1.908 (50MA < Price) | Bullish/Uptrend |
| Relative Strength Index (RSI) | Magnitude of price change;Analyzing oversold & overbought conditions | 77.903 <30 = Oversold 50-70 = Neutral>70 = Overbought | Overbought |
| Relative Volume (RVOL) | Asset’s trading volume in relation to its recent average volumes | Below cutoff line | Weak Volume |
LayerZero (ZRO) Price Prediction 2026 — ADX, RVI
In the chart, we analyze the strength and volatility of LayerZero (ZRO) using the following technical analysis indicators — Average Directional Index (ADX) and Relative Volatility Index (RVI).
From the readings on the chart above, we can make the following inferences regarding the price momentum of LayerZero (ZRO).
| INDICATOR | PURPOSE | READING | INFERENCE |
| Average Directional Index (ADX) | Strength of the trend momentum | 36.988 | Weak Trend |
| Relative Volatility Index (RVI) | Volatility over a specific period | 79.70 <50 = Low >50 = High | High Volatility |
Comparison of ZRO with BTC, ETH
Let us now compare the price movements of LayerZero (ZRO) with that of Bitcoin (BTC), and Ethereum (ETH).
From the above chart, we can interpret that the price action of ZRO is similar to that of BTC and ETH. That is, when the price of BTC and ETH increases or decreases, the price of ZRO also increases or decreases, respectively.
LayerZero (ZRO) Price Prediction 2027, 2028 – 2030
With the help of the aforementioned technical analysis indicators and trend patterns, let us predict the price of LayerZero (ZRO) in 2027, 2028, 2029, and 2030.
| Year | Bullish Price | Bearish Price |
| LayerZero (ZRO) Price Prediction 2027 | $12 | $0.6 |
| LayerZero (ZRO) Price Prediction 2028 | $14 | $0.5 |
| LayerZero (ZRO) Price Prediction 2029 | $16 | $0.4 |
| LayerZero (ZRO) Price Prediction 2030 | $18 | $0.3 |
Conclusion
If LayerZero (ZRO) establishes itself as a good investment in 2026, this year would be favorable to the cryptocurrency. In conclusion, the bullish LayerZero (ZRO) price prediction for 2026 is $3.055. Comparatively, the bearish LayerZero (ZRO) price prediction for 2026 is $0.798.
If there is a positive elevation in the market momentum and investors’ sentiment, then LayerZero (ZRO) might hit $10. Furthermore, with future upgrades and advancements in the LayerZero ecosystem, ZRO might surpass its current all-time high (ATH) of $7.53 and mark its new ATH.
FAQ
1. What is LayerZero (ZRO)?
LayerZero (ZRO) is an innovative blockchain interoperability protocol designed to enable seamless communication between different blockchain networks.
2. Where can you buy LayerZero (ZRO)?
LayerZero (ZRO) has been listed on many crypto exchanges which include Binance, Deepcoin, OKX, Bitrue, and Bybit.
3. Will LayerZero (ZRO) record a new ATH soon?
With the ongoing developments and upgrades within the LayerZero platform, LayerZero (ZRO) has a high possibility of reaching its ATH soon.
4. What is the current all-time high (ATH) of LayerZero (ZRO)?
LayerZero (ZRO) hit its current all-time high (ATH) of $7.53 on December 06, 2024.
5. What is the lowest price of LayerZero (ZRO)?
According to CoinMarketCap, ZRO hit its all-time low (ATL) of $0.903 on October 11, 2025.
6. Will LayerZero (ZRO) hit $10?
If LayerZero (ZRO) becomes one of the active cryptocurrencies that maintains a bullish trend, it might rally to hit $10 soon.
7. What will be the LayerZero (ZRO) price by 2027?
LayerZero (ZRO) price might reach $12 by 2027.
8. What will be the LayerZero (ZRO) price by 2028?
LayerZero (ZRO) price might reach $14 by 2028.
9. What will be the LayerZero (ZRO) price by 2029?
LayerZero (ZRO) price might reach $16 by 2029.
10. What will be the LayerZero (ZRO) price by 2030?
LayerZero (ZRO) price might reach $18 by 2030.
Top Crypto Predictions
Tezos (XTZ) Price Prediction
Stacks (STX) Price Prediction
Cardano (ADA) Price Prediction
Disclaimer: The opinion expressed in this chart is solely the author’s. It does not represent any investment advice. TheNewsCrypto team encourages all to do their own research before investing.
You May Also Like

Securities Fraud Investigation Into Corcept Therapeutics Incorporated (CORT) Announced – Shareholders Who Lost Money Urged To Contact Glancy Prongay Wolke & Rotter LLP, a Leading Securities Fraud Law Firm

Microsoft Corp. $MSFT blue box area offers a buying opportunity
