MSTR can't stop buying $BTC. Even as its stock price remains in a technical bear market, the company is spending $980 million on over 10K Bitcoin.MSTR can't stop buying $BTC. Even as its stock price remains in a technical bear market, the company is spending $980 million on over 10K Bitcoin.

Top risks facing MSTR stock as Strategy buys 10,625 Bitcoins

The MSTR stock price remains in a technical bear market on Monday, even as the company spends $980 million on 10,645 Bitcoin.

Summary
  • The MSTR stock price is facing multiple technical and fundamental headwinds this year.
  • It has formed a bearish flag pattern, pointing to more downside in the near term.
  • The stock may drop after the upcoming Bank of Japan interest rate decision.

Strategy, formerly known as MicroStrategy, was trading at $176.45, down by ~62% from its highest point this year. This decline has coincided with the ongoing weakness in Bitcoin (BTC), as it dropped from $126,300 in October to $90,000 today. 

In a statement, Michael Saylor said that the company acquired 10,645 coins valued at $980.3 million last week. This accumulation brought its total holdings to 671,268 coins, currently valued at over $60 billion. Still, MSTR stock price faces major risks that may push it lower in the near term.

MSTR stock is facing technical risks

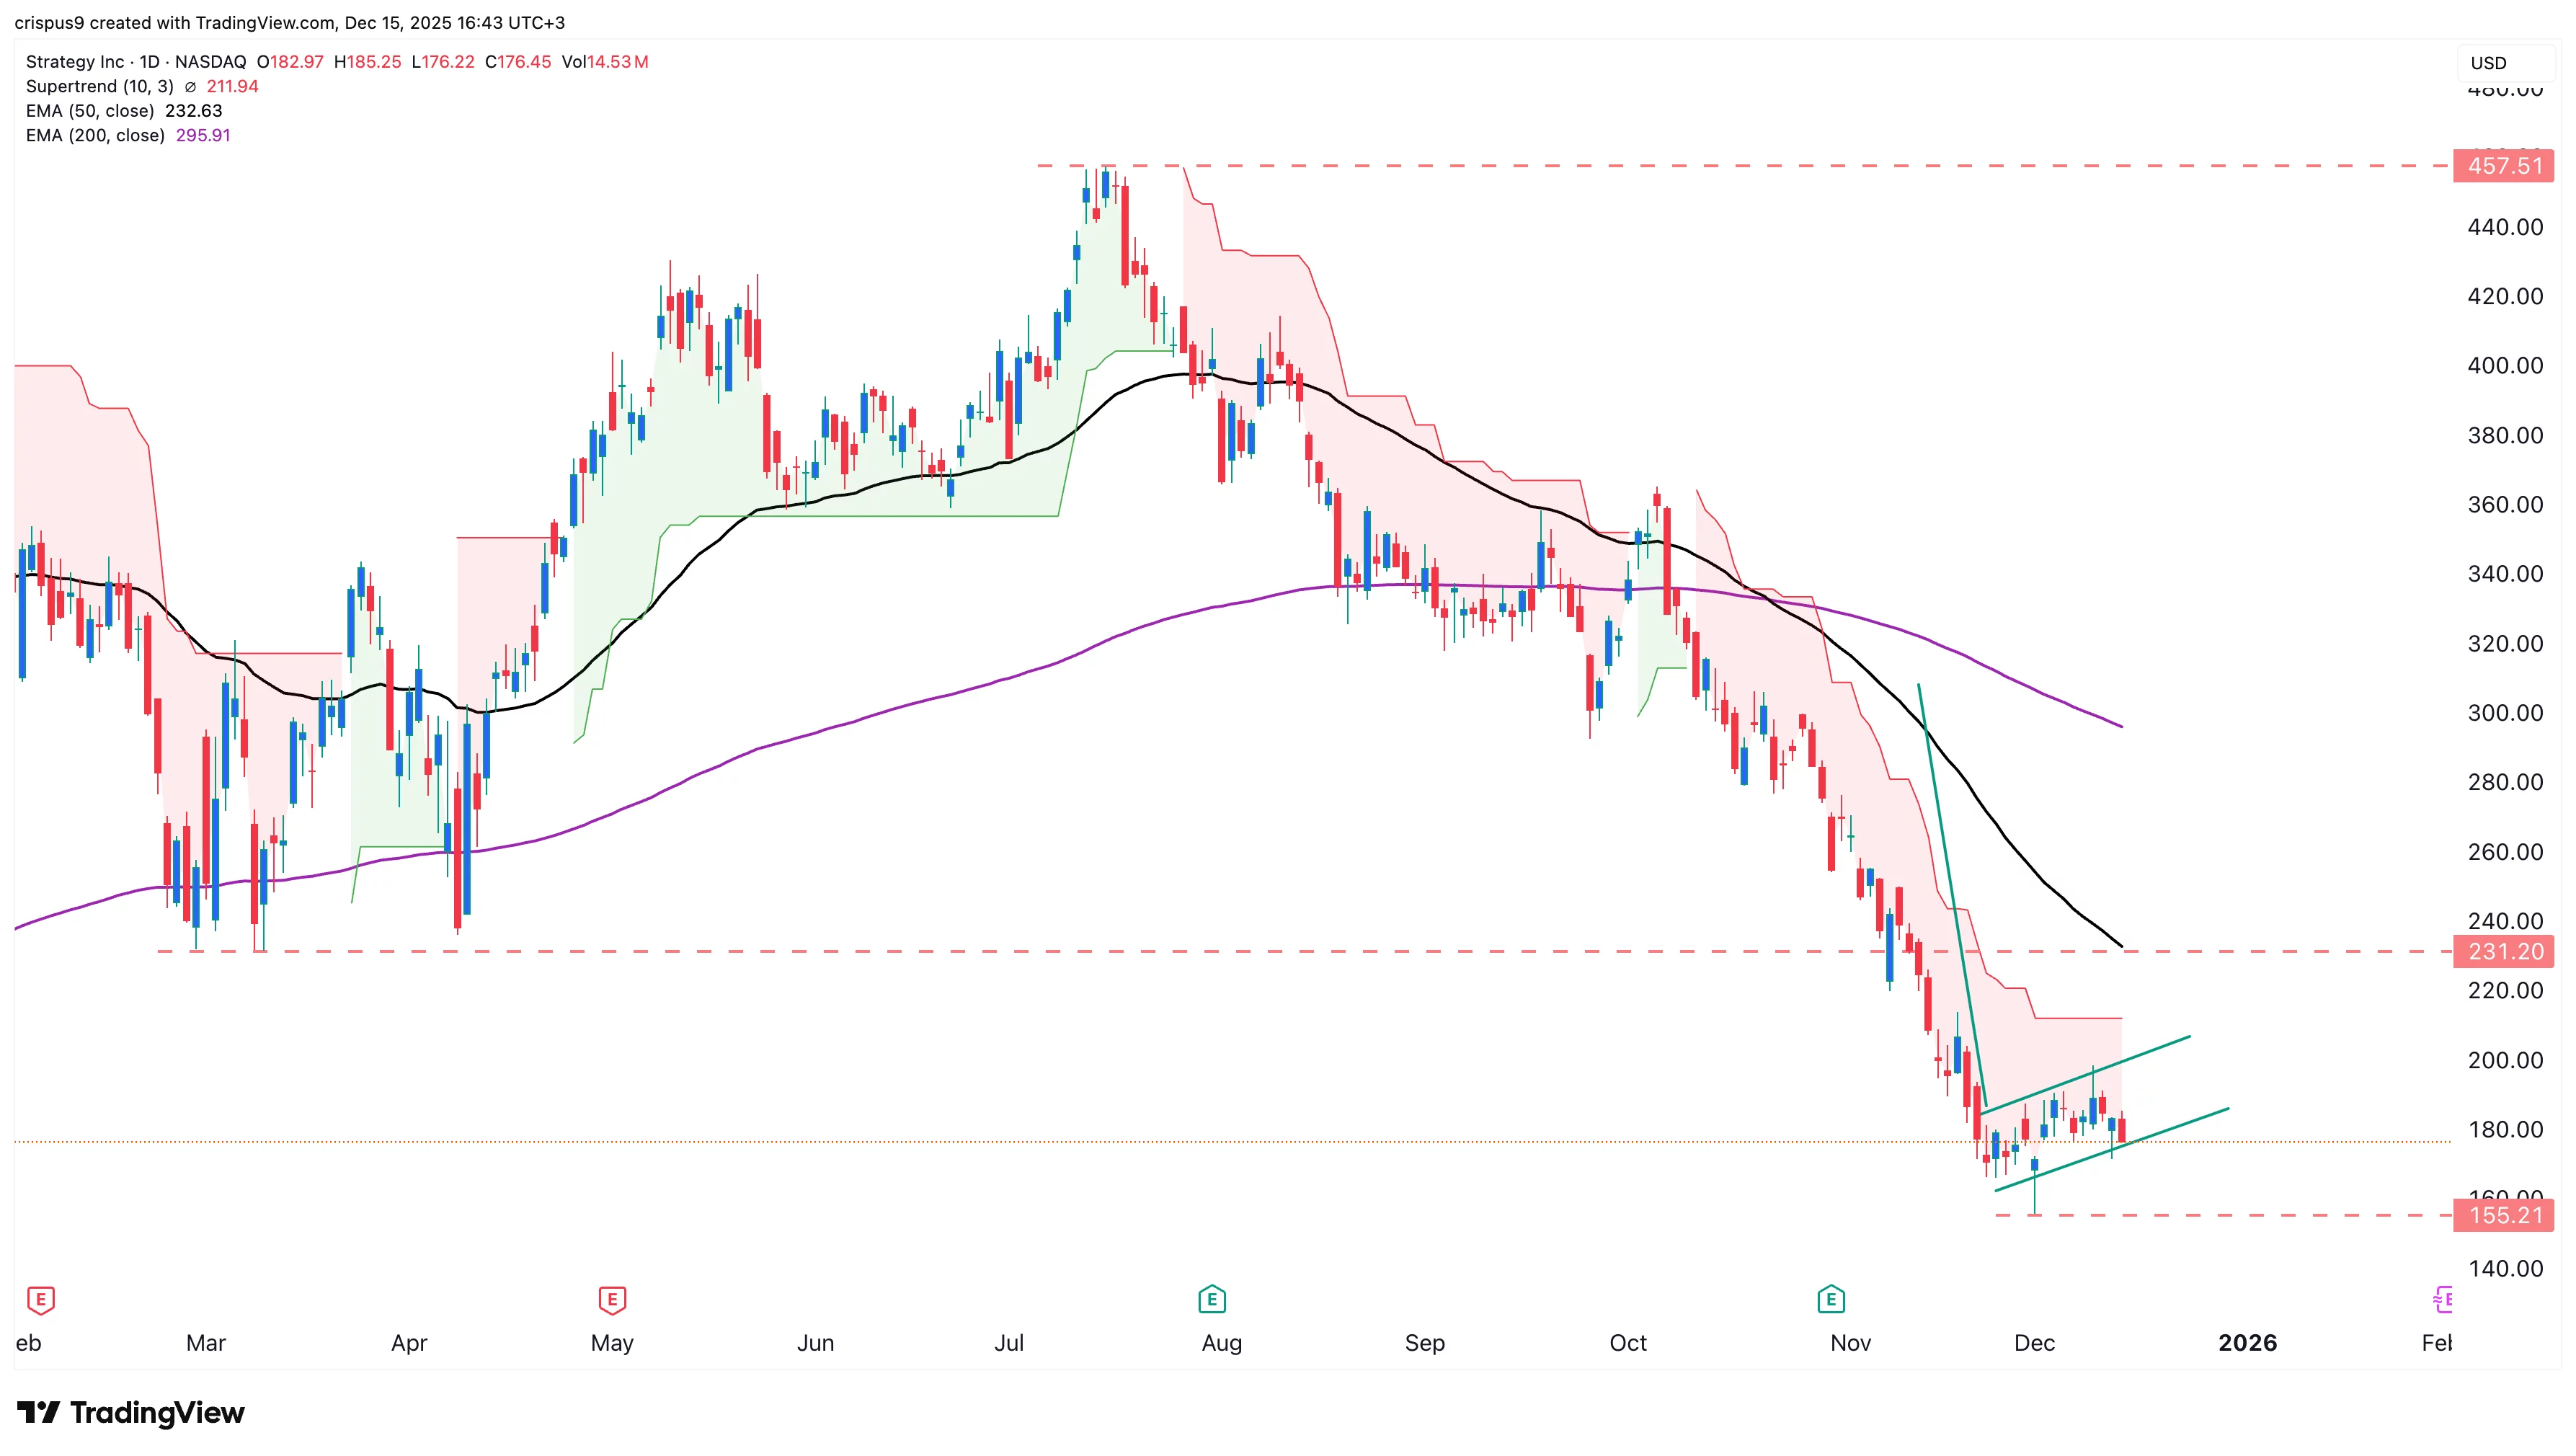
The daily chart shows that the MSTR stock price has crashed this year, moving from a high of $457 in July to the current $176. A closer look reveals that it has formed a bearish flag pattern, consisting of a flagpole-like line and an ascending channel. It is now in the flag section of this pattern. 

Strategy stock has also formed a death cross pattern, and it remains below the important support level at $230, its lowest point in February and April this year. It is also below the Supertrend indicator.

Therefore, the most likely MSTR stock price forecast is bearish, with the next key support being the year-to-date low of $155. A drop below that level will indicate further downside to $100.

mstr stock

Bitcoin price is at risk of falling to $75,000

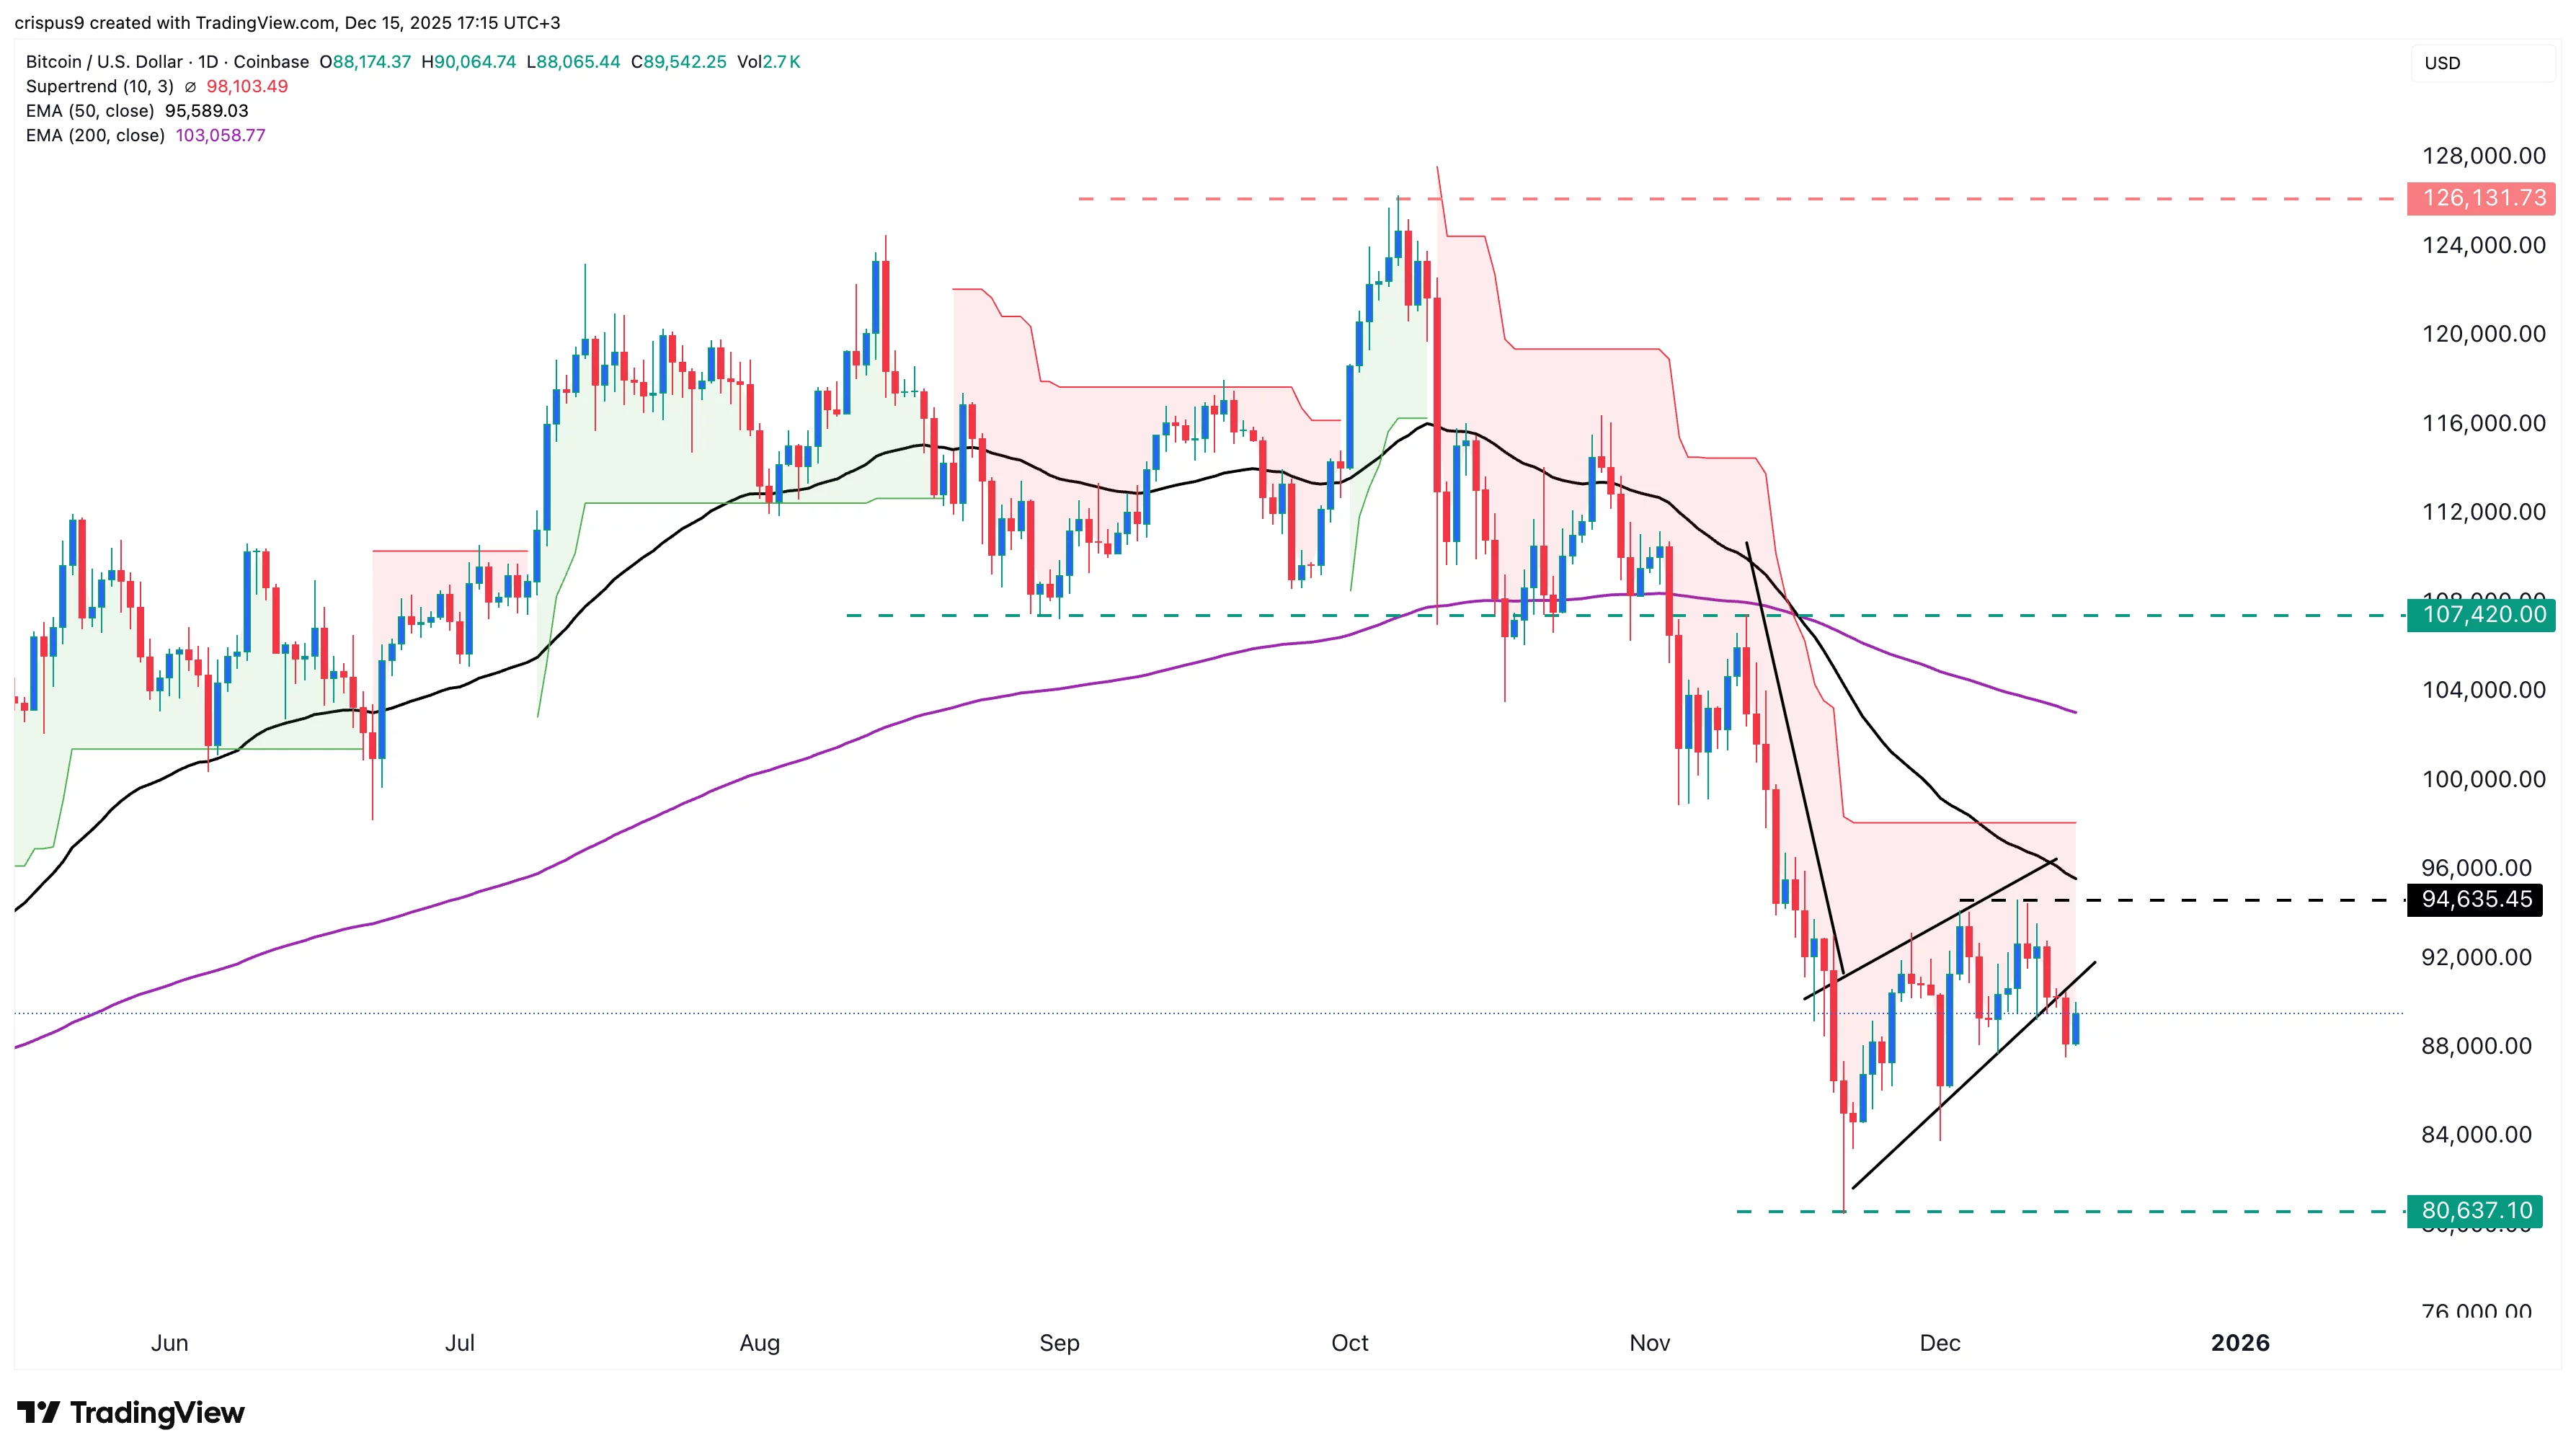
The BTC price is also at a significant risk of further downside in the near term. The daily chart indicates that it has formed a rising wedge pattern, a bearish flag pattern.

Bitcoin has also remained below all moving averages and the key resistance level at $94,635. It has also fallen below the Ichimoku cloud. 

Therefore, the coin may drop further to last month’s low of $80,600. A drop below that price will point to more downside to the April low of $75,000.

bitcoin price

BoJ interest rate hike

The other key risk that MSTR stock faces is the upcoming Bank of Japan interest rate decision on Friday. Kazuo Ueda, the central bank governor, has already telegraphed that it will hike rates to combat inflation, which has remained above 3%.

Polymarket data indicate that the probability of a rate hike has increased to 98%. This is important because it will occur as the Federal Reserve slashes interest rates.

Historically, a divergence between the Federal Reserve and the BoJ has led to greater downside because of the unwinding of the carry trade, which has persisted for many years.

Bitcoin also faces other risks, including ongoing deleveraging, as evidenced by falling futures open interest and a flattening funding curve. Therefore, further Bitcoin weakness will likely lead to a sell-off in Strategy stock over time.

Market Opportunity
TOP Network Logo
TOP Network Price(TOP)
$0.000096
$0.000096$0.000096
0.00%
USD
TOP Network (TOP) Live Price Chart
Disclaimer: The articles reposted on this site are sourced from public platforms and are provided for informational purposes only. They do not necessarily reflect the views of MEXC. All rights remain with the original authors. If you believe any content infringes on third-party rights, please contact service@support.mexc.com for removal. MEXC makes no guarantees regarding the accuracy, completeness, or timeliness of the content and is not responsible for any actions taken based on the information provided. The content does not constitute financial, legal, or other professional advice, nor should it be considered a recommendation or endorsement by MEXC.

You May Also Like

Trump Cancels Tech, AI Trade Negotiations With The UK

Trump Cancels Tech, AI Trade Negotiations With The UK

The US pauses a $41B UK tech and AI deal as trade talks stall, with disputes over food standards, market access, and rules abroad.   The US has frozen a major tech
Share
LiveBitcoinNews2025/12/17 01:00
Egrag Crypto: XRP Could be Around $6 or $7 by Mid-November Based on this Analysis

Egrag Crypto: XRP Could be Around $6 or $7 by Mid-November Based on this Analysis

Egrag Crypto forecasts XRP reaching $6 to $7 by November. Fractal pattern analysis suggests a significant XRP price surge soon. XRP poised for potential growth based on historical price patterns. The cryptocurrency community is abuzz after renowned analyst Egrag Crypto shared an analysis suggesting that XRP could reach $6 to $7 by mid-November. This prediction is based on the study of a fractal pattern observed in XRP’s past price movements, which the analyst believes is likely to repeat itself in the coming months. According to Egrag Crypto, the analysis hinges on fractal patterns, which are used in technical analysis to identify recurring market behavior. Using the past price charts of XRP, the expert has found a certain fractal that looks similar to the existing market structure. The trend indicates that XRP will soon experience a great increase in price, and the asset will probably reach the $6 or $7 range in mid-November. The chart shared by Egrag Crypto points to a rising trend line with several Fibonacci levels pointing to key support and resistance zones. This technical structure, along with the fractal pattern, is the foundation of the price forecast. As XRP continues to follow the predicted trajectory, the analyst sees a strong possibility of it reaching new highs, especially if the fractal behaves as expected. Also Read: Why XRP Price Remains Stagnant Despite Fed Rate Cut #XRP – A Potential Similar Set-Up! I've been analyzing the yellow fractal from a previous setup and trying to fit it into various formations. Based on the fractal formation analysis, it suggests that by mid-November, #XRP could be around $6 to $7! Fractals can indeed be… pic.twitter.com/HmIlK77Lrr — EGRAG CRYPTO (@egragcrypto) September 18, 2025 Fractal Analysis: The Key to XRP’s Potential Surge Fractals are a popular tool for market analysis, as they can reveal trends and potential price movements by identifying patterns in historical data. Egrag Crypto’s focus on a yellow fractal pattern in XRP’s price charts is central to the current forecast. Having contrasted the market scenario at the current period and how it was at an earlier time, the analyst has indicated that XRP might revert to the same price scenario that occurred at a later cycle in the past. Egrag Crypto’s forecast of $6 to $7 is based not just on the fractal pattern but also on broader market trends and technical indicators. The Fibonacci retracements and extensions will also give more insight into the price levels that are likely to be experienced in the coming few weeks. With mid-November in sight, XRP investors and traders will be keeping a close eye on the market to see if Egrag Crypto’s analysis is true. If the price targets are reached, XRP could experience one of its most significant rallies in recent history. Also Read: Top Investor Issues Advance Warning to XRP Holders – Beware of this Risk The post Egrag Crypto: XRP Could be Around $6 or $7 by Mid-November Based on this Analysis appeared first on 36Crypto.
Share
Coinstats2025/09/18 18:36
Truoux: In the Institutionalized Crypto Markets, How Investors Can Strengthen Anti-Scam Awareness

Truoux: In the Institutionalized Crypto Markets, How Investors Can Strengthen Anti-Scam Awareness

As the crypto market draws increasing attention from institutions, investors must remain vigilant, guard against various scam tactics, and rationally choose compliant
Share
Techbullion2025/12/17 01:31