

Ethereum Price Prediction: Analysts Flag $1.5K Risk Before Potential Cycle Highs

Ethereum and Bitcoin continue to trade in defined ranges as crypto markets show mixed momentum, movements restrained, and on-chain data gaining the attention of traders and analysts. Discussions on current Ethereum price predictions have focused on whether the market could be in store for extended consolidation or renewed volatility.
Coin Bureau insights from IntoTheCryptoVerse Analysis suggests a scenario where Ethereum would have to revisit lower levels before any sustained expansion. In the meantime, the commentary situates that the current conditions are transitional rather than directional.
 Source: x/@coinbureau
Ethereum Price Prediction Centers on the $2,000 Range
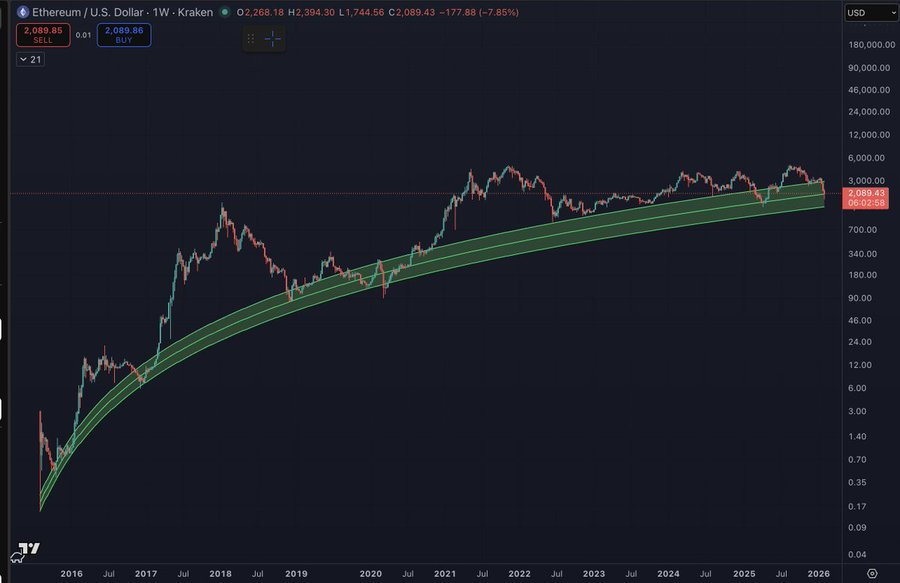
The current price of Ethereum is close to $2,000, a range often called the “mid-value zone.” Experts say that in the past, this zone served as a holding zone for the market during a prolonged period of stagnation. It can be observed that the movement of the price around this zone does not manifest any significant momentum.
According to various Ethereum prediction charts, in similar stages of previous market cycles, sideways price movements were noted rather than a strong breakout. These are usually periods of volatility compression, and analysts are watching for further developments in these sectors.
Analysts Outline Potential Retest of $1.5K Support
The analysis cited by Coin Bureau indicated that there’s also a risk of decline to the lower pricing band at about $1,500, but later on in the cycle. The price structures from previous Ethereum cycles indicate that each Ethereum price rally was followed by some retracement before it began to push forward. This trend is apparent in most Ethereum price prediction models.
In prior cycles, there have also been significant drawdowns before powerful expansions. Such pullbacks happened even when overall network activity was stable. Such price action is said to be a feature of ‘late-stage shakeouts’ rather than changes in the underlying trend.
 Source: X/@coinbureau
On-Chain Metrics Show Network Stability
Data from Glassnode’s on-chain analytics shows Ethereum’s market capitalization is trending in a consolidated pattern. It is believed that a consolidated market capitalization level reflects the stability of the capital remaining in the network, as opposed to the exiting of funds on a large scale. This pattern is unlike the deeper bear phases seen in the prior cycles.
Market cap is also a major factor when performing price prediction for Ethereum since a consistent decline in this regard usually signals a downward movement for the cryptocurrency. This, however, does not seem to be the case at the moment. It appears to be a period of accumulation for the asset, just as in previous
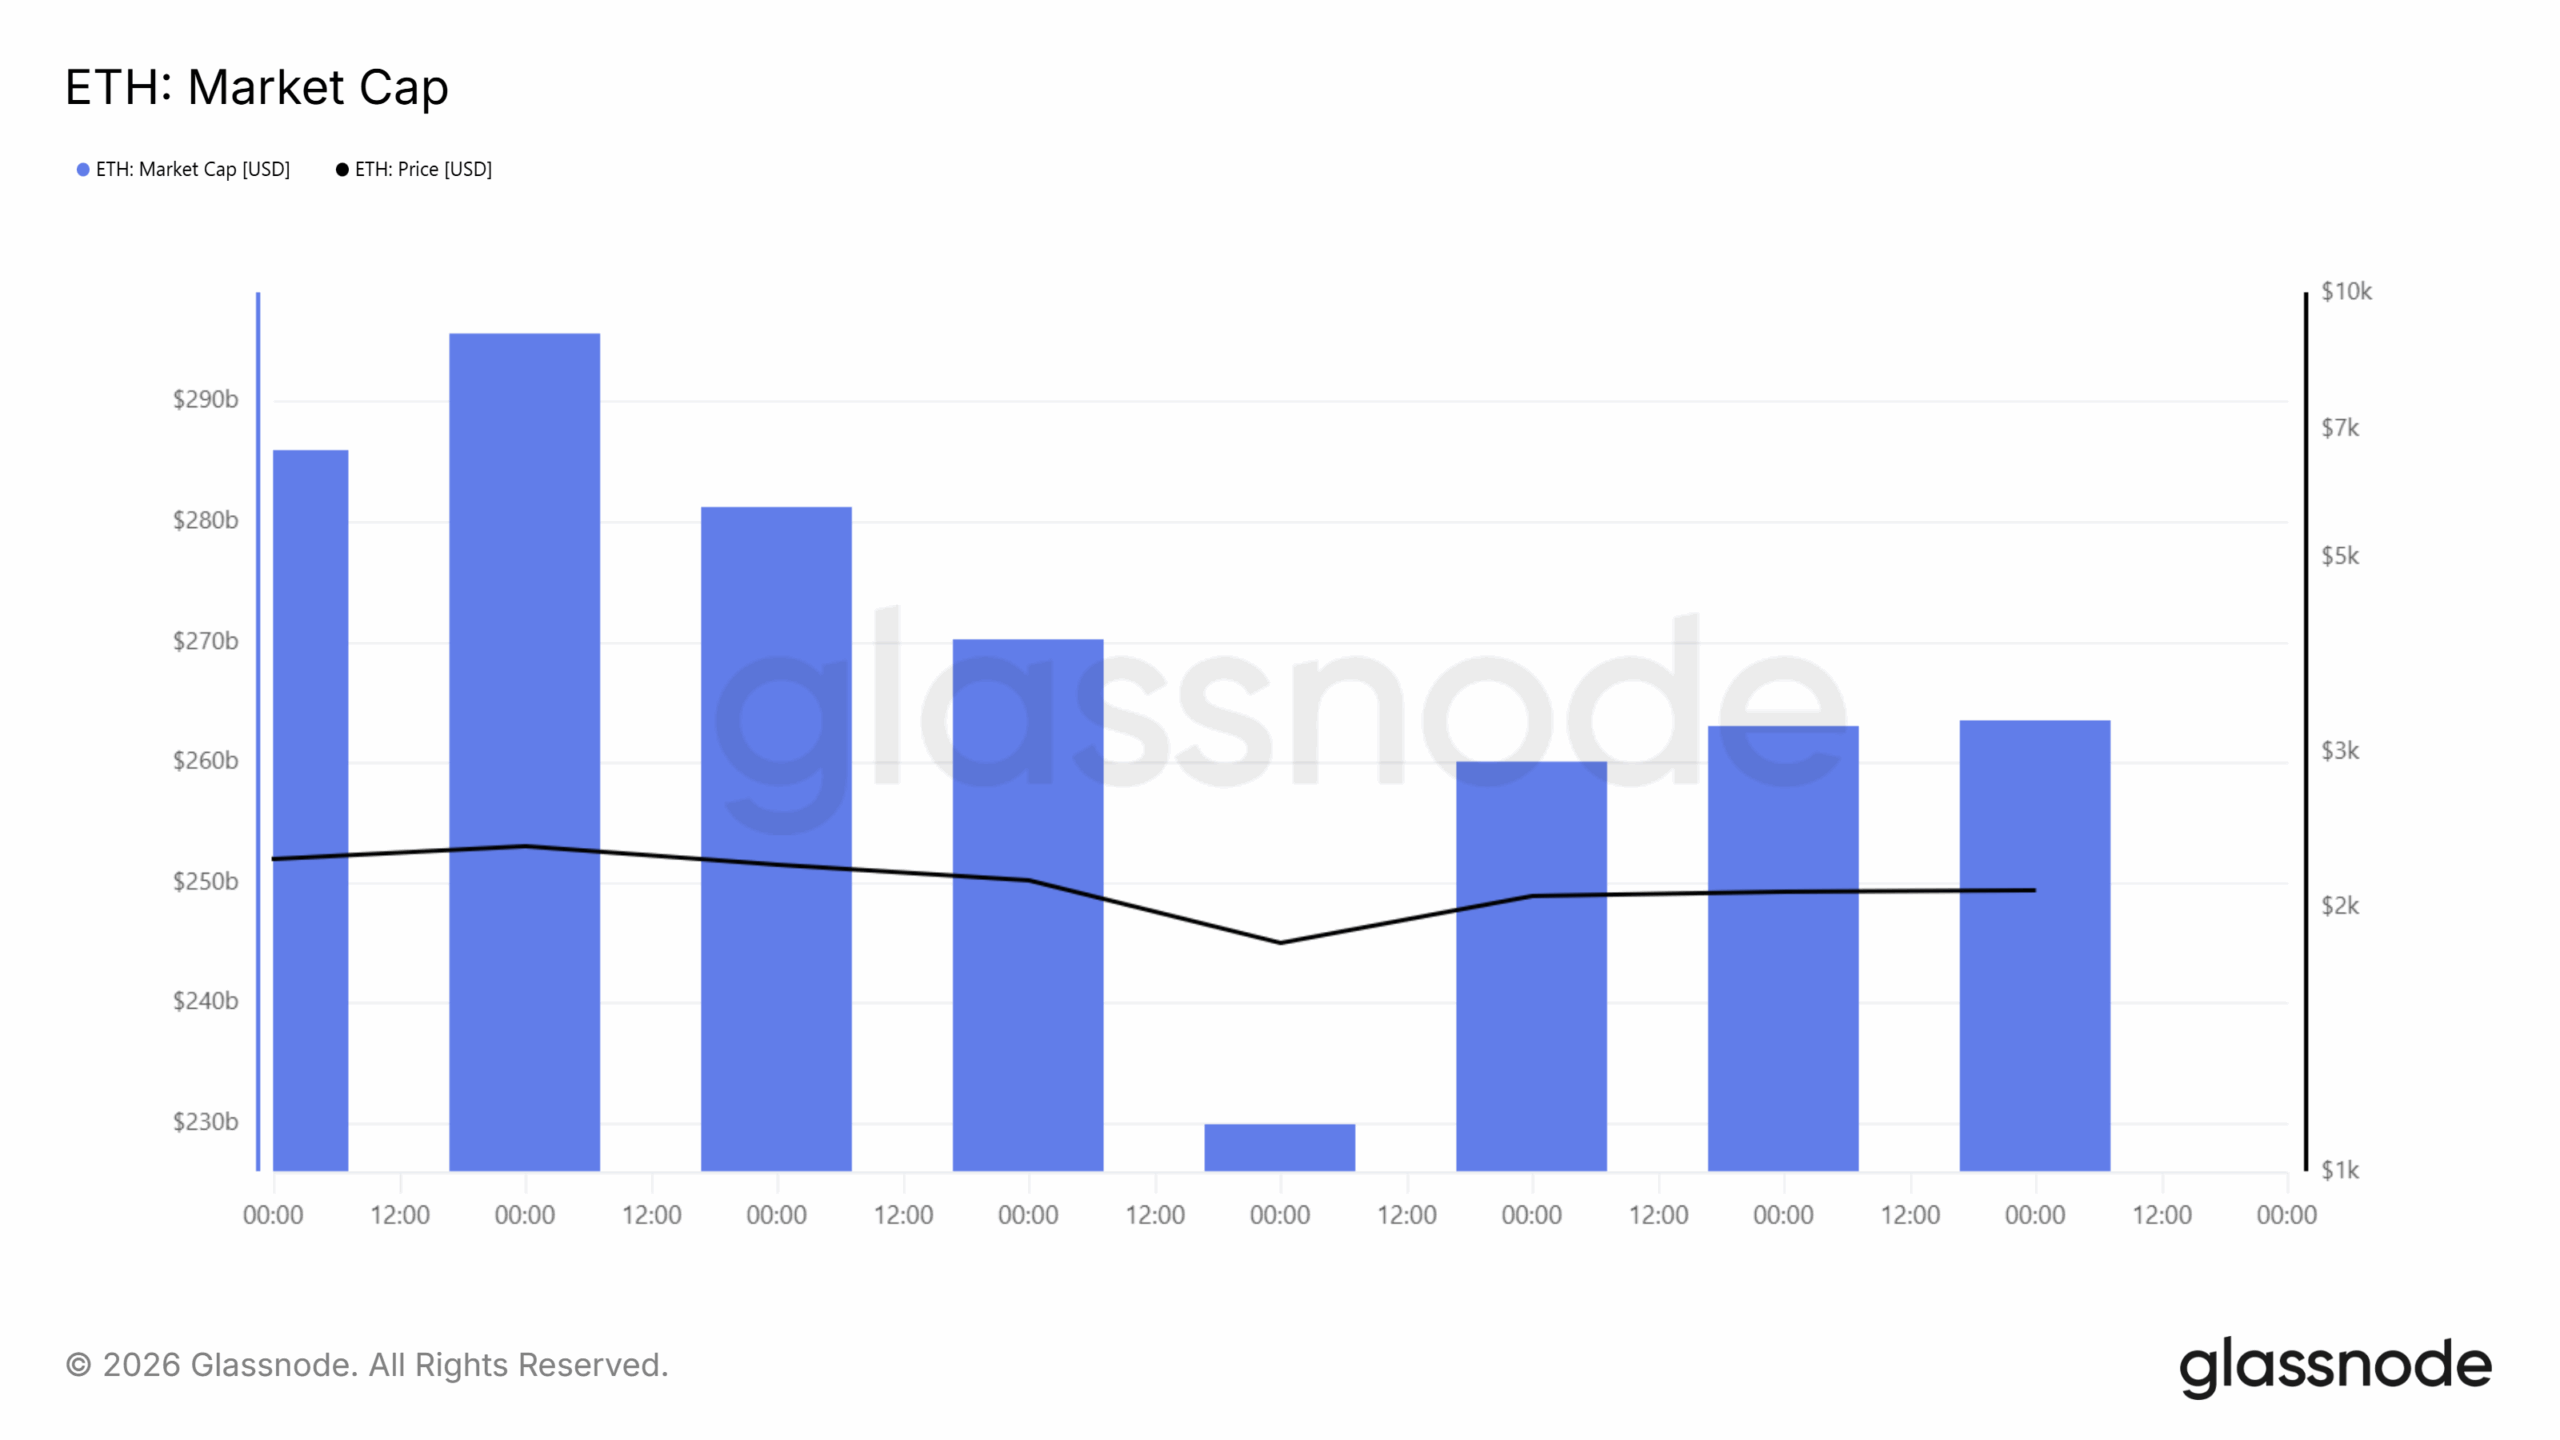 ETHs Market Cap
Supporting this theory, active addresses reveal that active Ethereum addresses follow a fluctuating pattern, rather than decreasing continuously. The number of active Ethereum addresses appears to increase at regular periods.
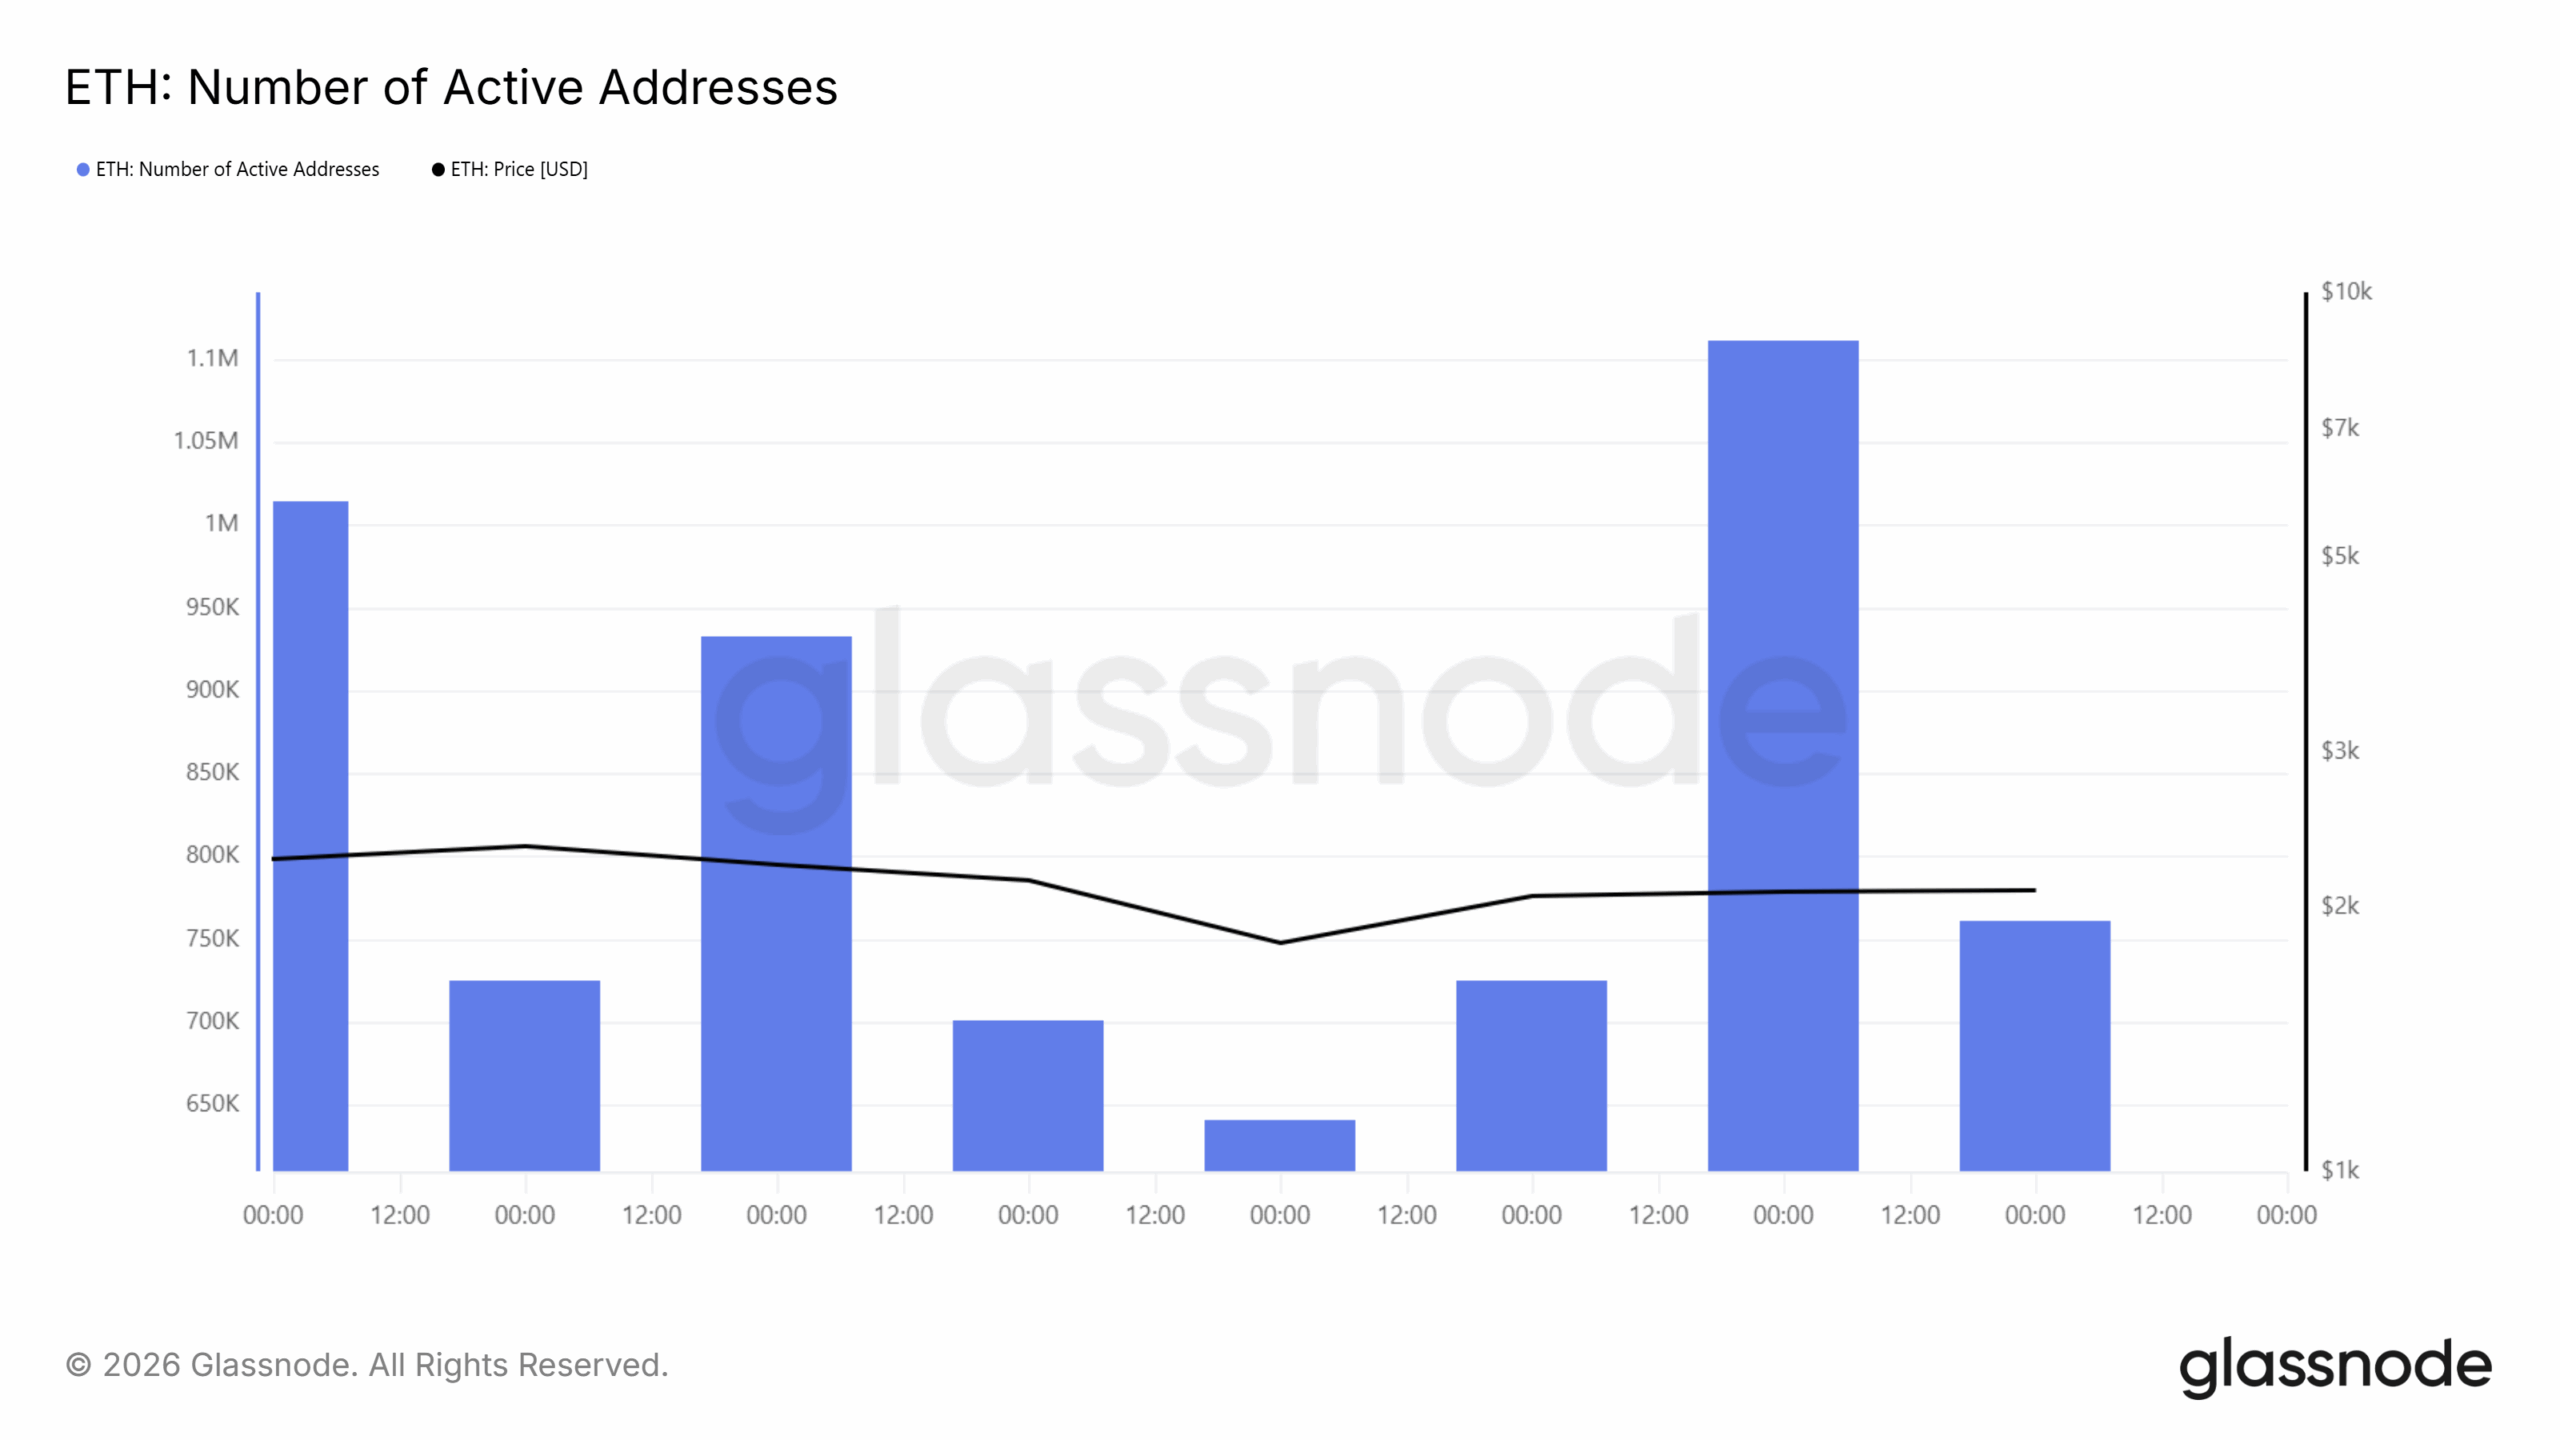 ETHs Number of Active Addresses
Transaction volume also shows notable spikes during the same period. Higher transaction counts appear while price remains range-bound. Similar divergences were seen in previous cycles, during phases of consolidation that preceded larger price movements.
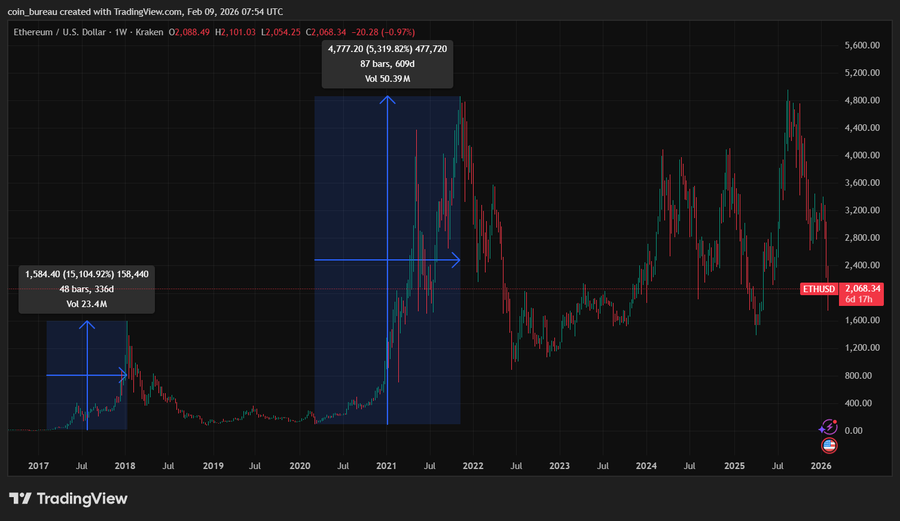
Long-Term Projections Reflect Diminishing Returns
Historical data, as prior analyzed, creates a basis of reference for the analysis. The 2017-2018 cycle is valued to have achieved more than 15,000% growth, whereas the growth achieved within the 2020-2021 cycle has surpassed 5,000%. A model of diminishing returns is currently under consideration.
As per this model, it is estimated by Ethereum price prediction for the upcoming growth phase to rise by between 1,500 and 2,000 percent, leading to a potential and possible long-term price range of between $24,000 and $32,000 based on the proportionate cycle.
Disclaimer: This analysis is based on market trends and does not guarantee future results. It should not be treated as financial advice. Cryptocurrency investments involve risk, so always do your own research (DYOR) before investing.
You May Also Like

Why It Could Outperform Pepe Coin And Tron With Over $7m Already Raised

XRP Sees Panic Selling as Glassnode Data Shows Significant Holder Losses
