

Quant (QNT) Price Analysis: Triangle Pattern Signals Potential $160 Upside
- QNT extends its weekly decline with consistent selling pressure.
- Market activity remains subdued as volume trends soften.
- The symmetrical triangle pattern tightens on the 2D chart.
- Treasury Reserve distributions boost community confidence.
Quant (QNT) continues to move lower as sellers dominate price action, keeping the token on a downward path. Over the past 24 hours, it has dropped 2.47%, and the weekly picture also remains weak, reflecting a broader 3.29% decline over recent trading sessions.
At present, QNT trades near $73.70, while overall activity remains relatively light. Daily trading volume stands around $13.39 million, falling 4.57% in the last 24 hours, yet market capitalization sits near $889.69 million after climbing 4.52% during recent market activity.
Also Read: Quant (QNT) Consolidation Ends Soon: Targets $174 and $259 in Sight
Quant Symmetrical Triangle Signals Critical Phase
On the 2D QNT chart, the price is forming a clear symmetrical triangle, defined by descending resistance and ascending support. The lower trendline has been respected multiple times, showing buyers defending this zone. Volatility is compressing as the price moves toward the apex, signaling growing pressure and a potential breakout on higher timeframes.
According to the crypto analyst @butterfly_chart, QNT is bouncing from the ascending support, suggesting accumulation below resistance. If the price breaks above the triangle, upside targets commonly tracked are $100, $120, and $145, based on prior reaction levels. A full measured move from the triangle projects a final upside target near $160 on the 2D chart.
However, confirmation is required despite positive projections. With heavy buying volume above the declining resistance, a breakout will confirm further advances up to targets of $100-$160. Failure of the ascending support will negate this trading setup, thereby posing a downside risk. Until then, the price may keep oscillating in a symmetrical triangle.
Community Support Strengthens Through Treasury Distribution
Big news for the Quant community. The network is continuing to thank long-time supporters by unloading additional value back into the network. The Quant Network is continuing to establish greater trust and commitment to its users as it presses forward in development and adoption.
However, the QNT tokens from the Treasury Reserve are being dispersed to the token holders and stakers. This is a good development towards engaging with the communities and increasing their participation. This indicates that Quant values their ecosystem members and wants to inspire loyalty to their vision.
Also Read: Quant (QNT) Market Outlook: Will It Break $272 in 2025?
You May Also Like
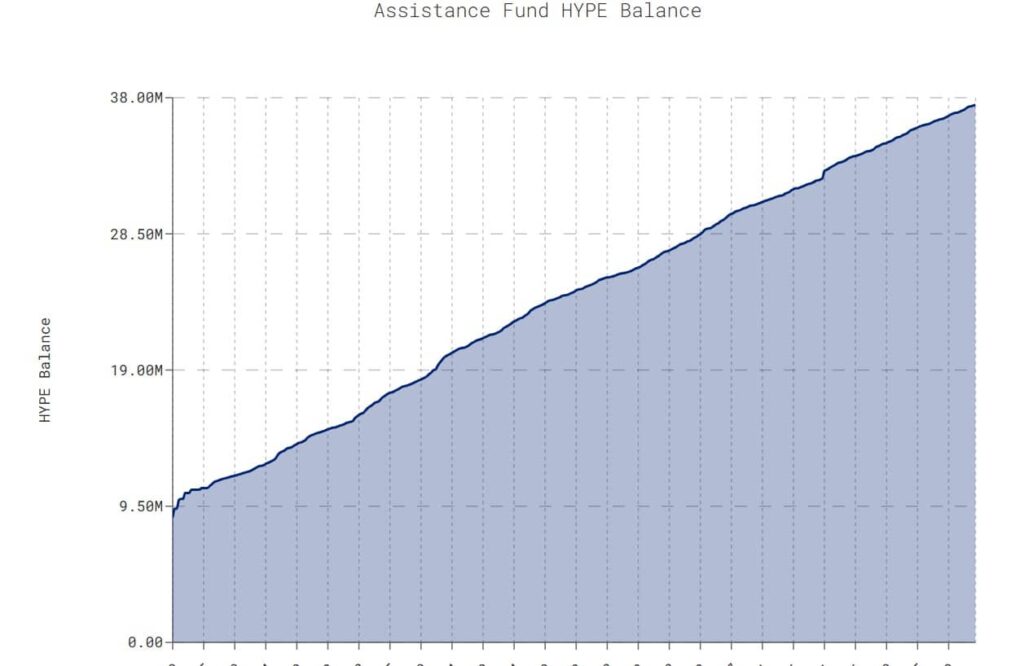
HYPE Token Eyes $40 After Hyperliquid Approves Major Token Burn

Trusted Experts in Water Line Repair Services
