Justin Sun Pushes TRX Accumulation as Tron Outperforms Bitcoin
Tron TRX $0.28 24h volatility: 2.1% Market cap: $26.59 B Vol. 24h: $919.48 M founder Justin Sun has praised his company’s strategy of accumulating TRX as a core treasury asset.
The comment comes as TRX shows resilience compared to the broader crypto market amid the ongoing downturn.
On February 5, Tron Inc. acquired 175,507 TRX tokens at an average price of $0.28. The purchase brings the company’s total TRX holdings to more than 679.9 million tokens, worth around $540 million at current market prices.
Tron aims to continue expanding its digital asset treasury (DAT) to support long-term shareholder value.
TRX Outperforms Broader Market
TRX has outperformed much of the crypto market in recent months. The token peaked near $0.45 in 2024 before retracing to around $0.28 at the time of writing.
TRX is down just 1.3% year-to-date, significantly outperforming Bitcoin, which has fallen 19% over the same period.
Market-wide weakness in January has had a limited impact on Tron relative to top altcoins. Over the past month, the total crypto market cap fell by around 25%, while Tron’s market value declined by only 4%.
Meanwhile, Tron continues to post strong network usage. The blockchain recorded over 100 million monthly active addresses in January, as the stablecoin market cap on the network reached $84.5 billion.
During this time, transaction activity also surged to 342 million.
What’s Next for TRX?
On the daily chart, TRX continues to trade below the 20-day Bollinger Bands midline. The price is supported by the lower band, which suggests that selling pressure remains present but it is not extreme.
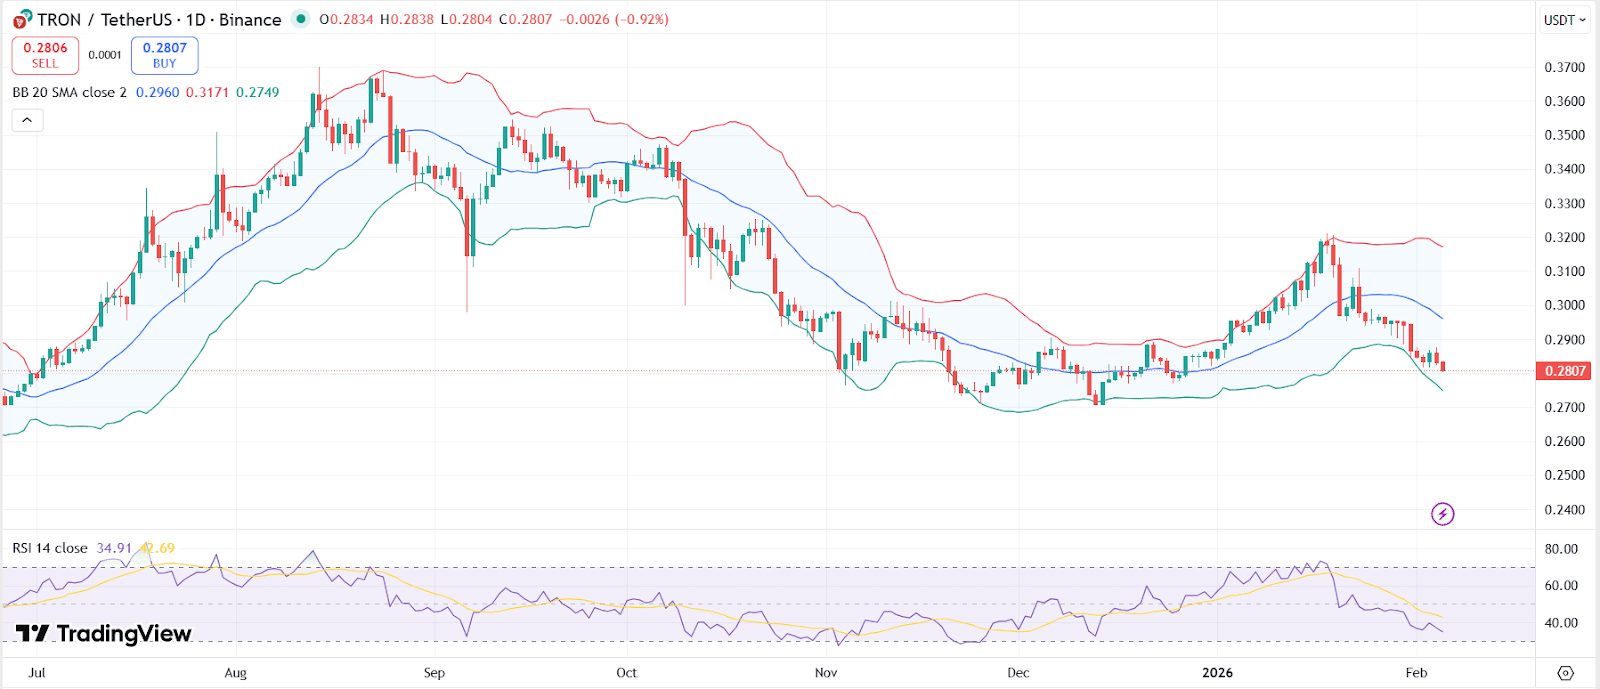
TRX’s price chart with RSI and Bollinger Bands. | Source: TradingView
The Relative Strength Index (RSI) currently sits around oversold territory at 34. This indicates bearish momentum but also potential for a short-term bounce if selling pressure eases.
Analyst SilverBullet stated on X that TRX is overvalued and could dump hard in the near-term. Traders should watch for key support around $0.27. A breakdown from this level could lead the token to a pullback to $0.25.
However, if TRX reclaims the Bollinger midline and crosses the $0.30 resistance level, it could see a short-term rally to $0.32.
nextThe post Justin Sun Pushes TRX Accumulation as Tron Outperforms Bitcoin appeared first on Coinspeaker.
You May Also Like

Trump roasts Mike Johnson for saying grace at prayer event: 'Excuse me, it's lunch!'

Where Can You Turn $1,000 Into $5,000 This Week? Experts Point Towards Remittix As The Best Option